


Avalanche (AVAX) fell again on the daily AVAXUSDT chart on Binance, last marked near $8.80 after a small daily drop.
The chart timestamp shows Feb. 13, 2026, and price remains well below the 50 day EMA, which sits around $11.48. That gap keeps the broader structure bearish.
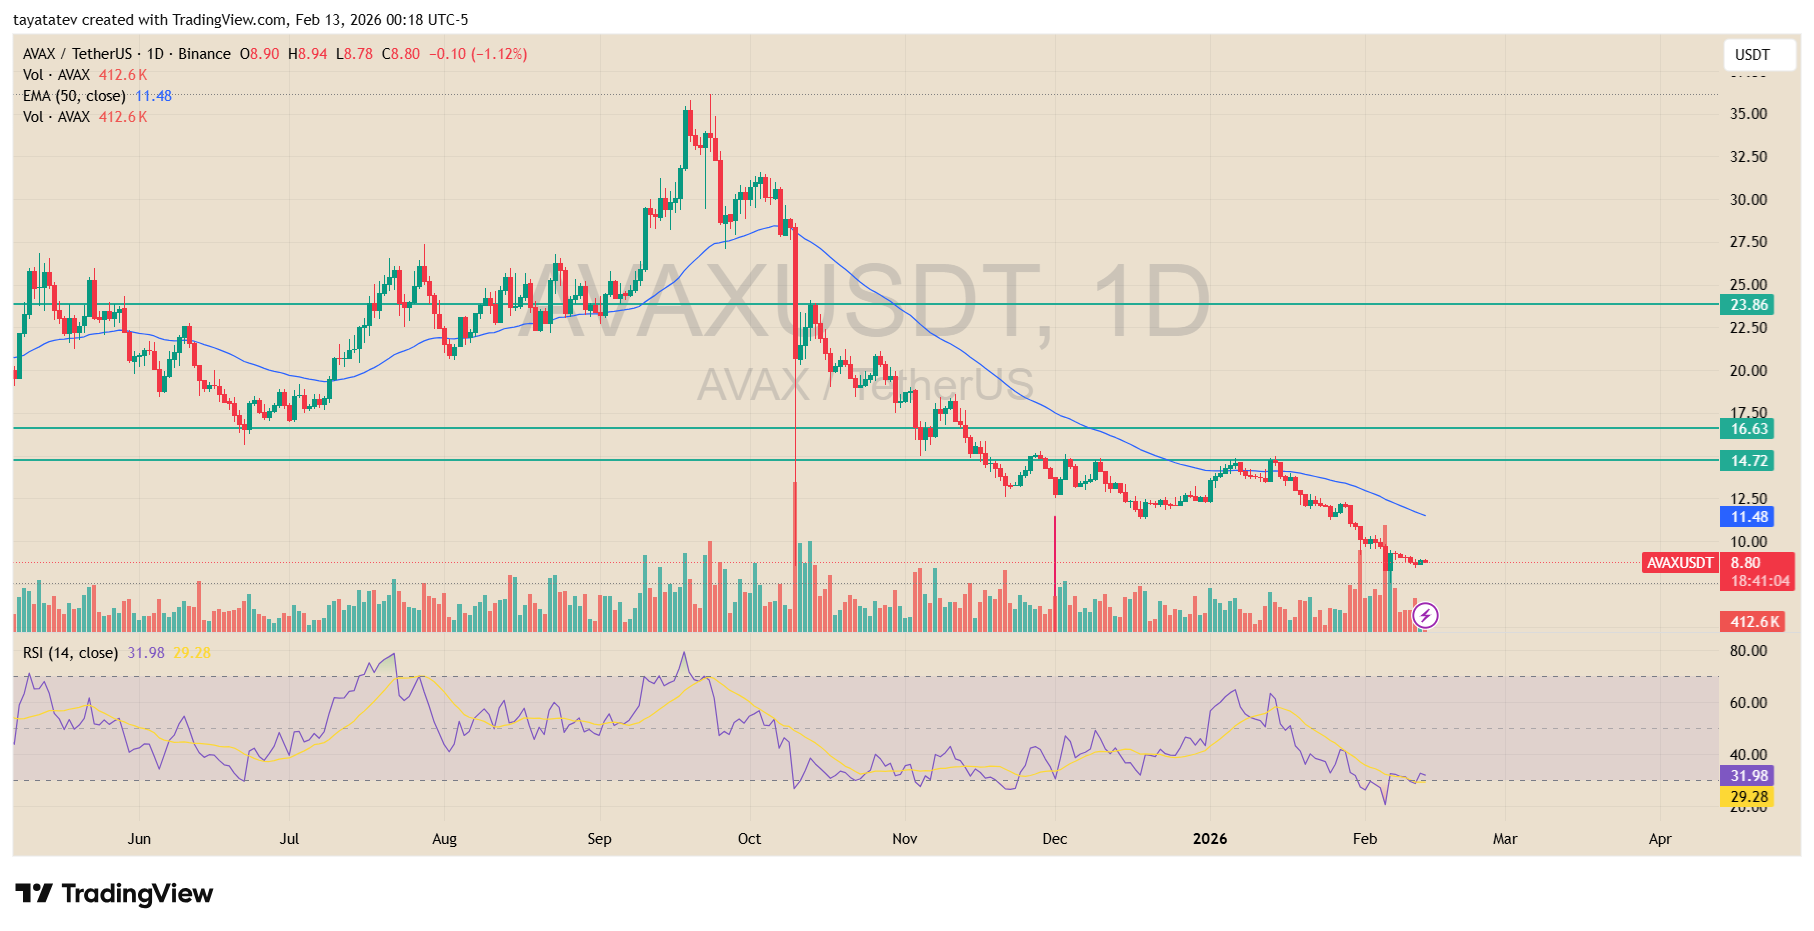
The downtrend has been in place since the late 2025 peak near the mid $30s. After that top, AVAX printed a steep selloff, then made a series of lower highs into 2026.
Each rebound faded earlier than the last, and price kept sliding into February, which signals sellers still control the trend.
The nearest “green line” overhead on this chart sits around $14.72, with another higher level near $16.63. Those lines now act like resistance because price previously traded around them and later broke lower.
However, AVAX would usually need to clear closer hurdles first, including reclaiming the $10 area and then pushing back above the 50 day EMA near $11.48. Without those steps, the move into the first green line often stays out of reach.
Momentum also looks weak. The RSI sits near the low 30s, which shows heavy selling pressure and only a modest bounce attempt so far.
At the same time, the 50 day EMA still slopes down, so the trend remains pointed lower unless price starts reclaiming key levels and holding them.
Stay ahead in the crypto world – follow us on X for the latest updates, insights, and trends!🚀
AVAX stays in a downtrend as price holds near short term support
Avalanche (AVAX) trades near $8.75 on the AVAXUSDT perpetual chart, with price still capped below both the 7 period and 25 period moving averages. As a result, the short term structure remains bearish.
The chart shows a sharp selloff into early February, followed by a weak rebound that failed to reclaim prior breakdown levels.
Therefore, sellers continue to defend the upper zones on each bounce.
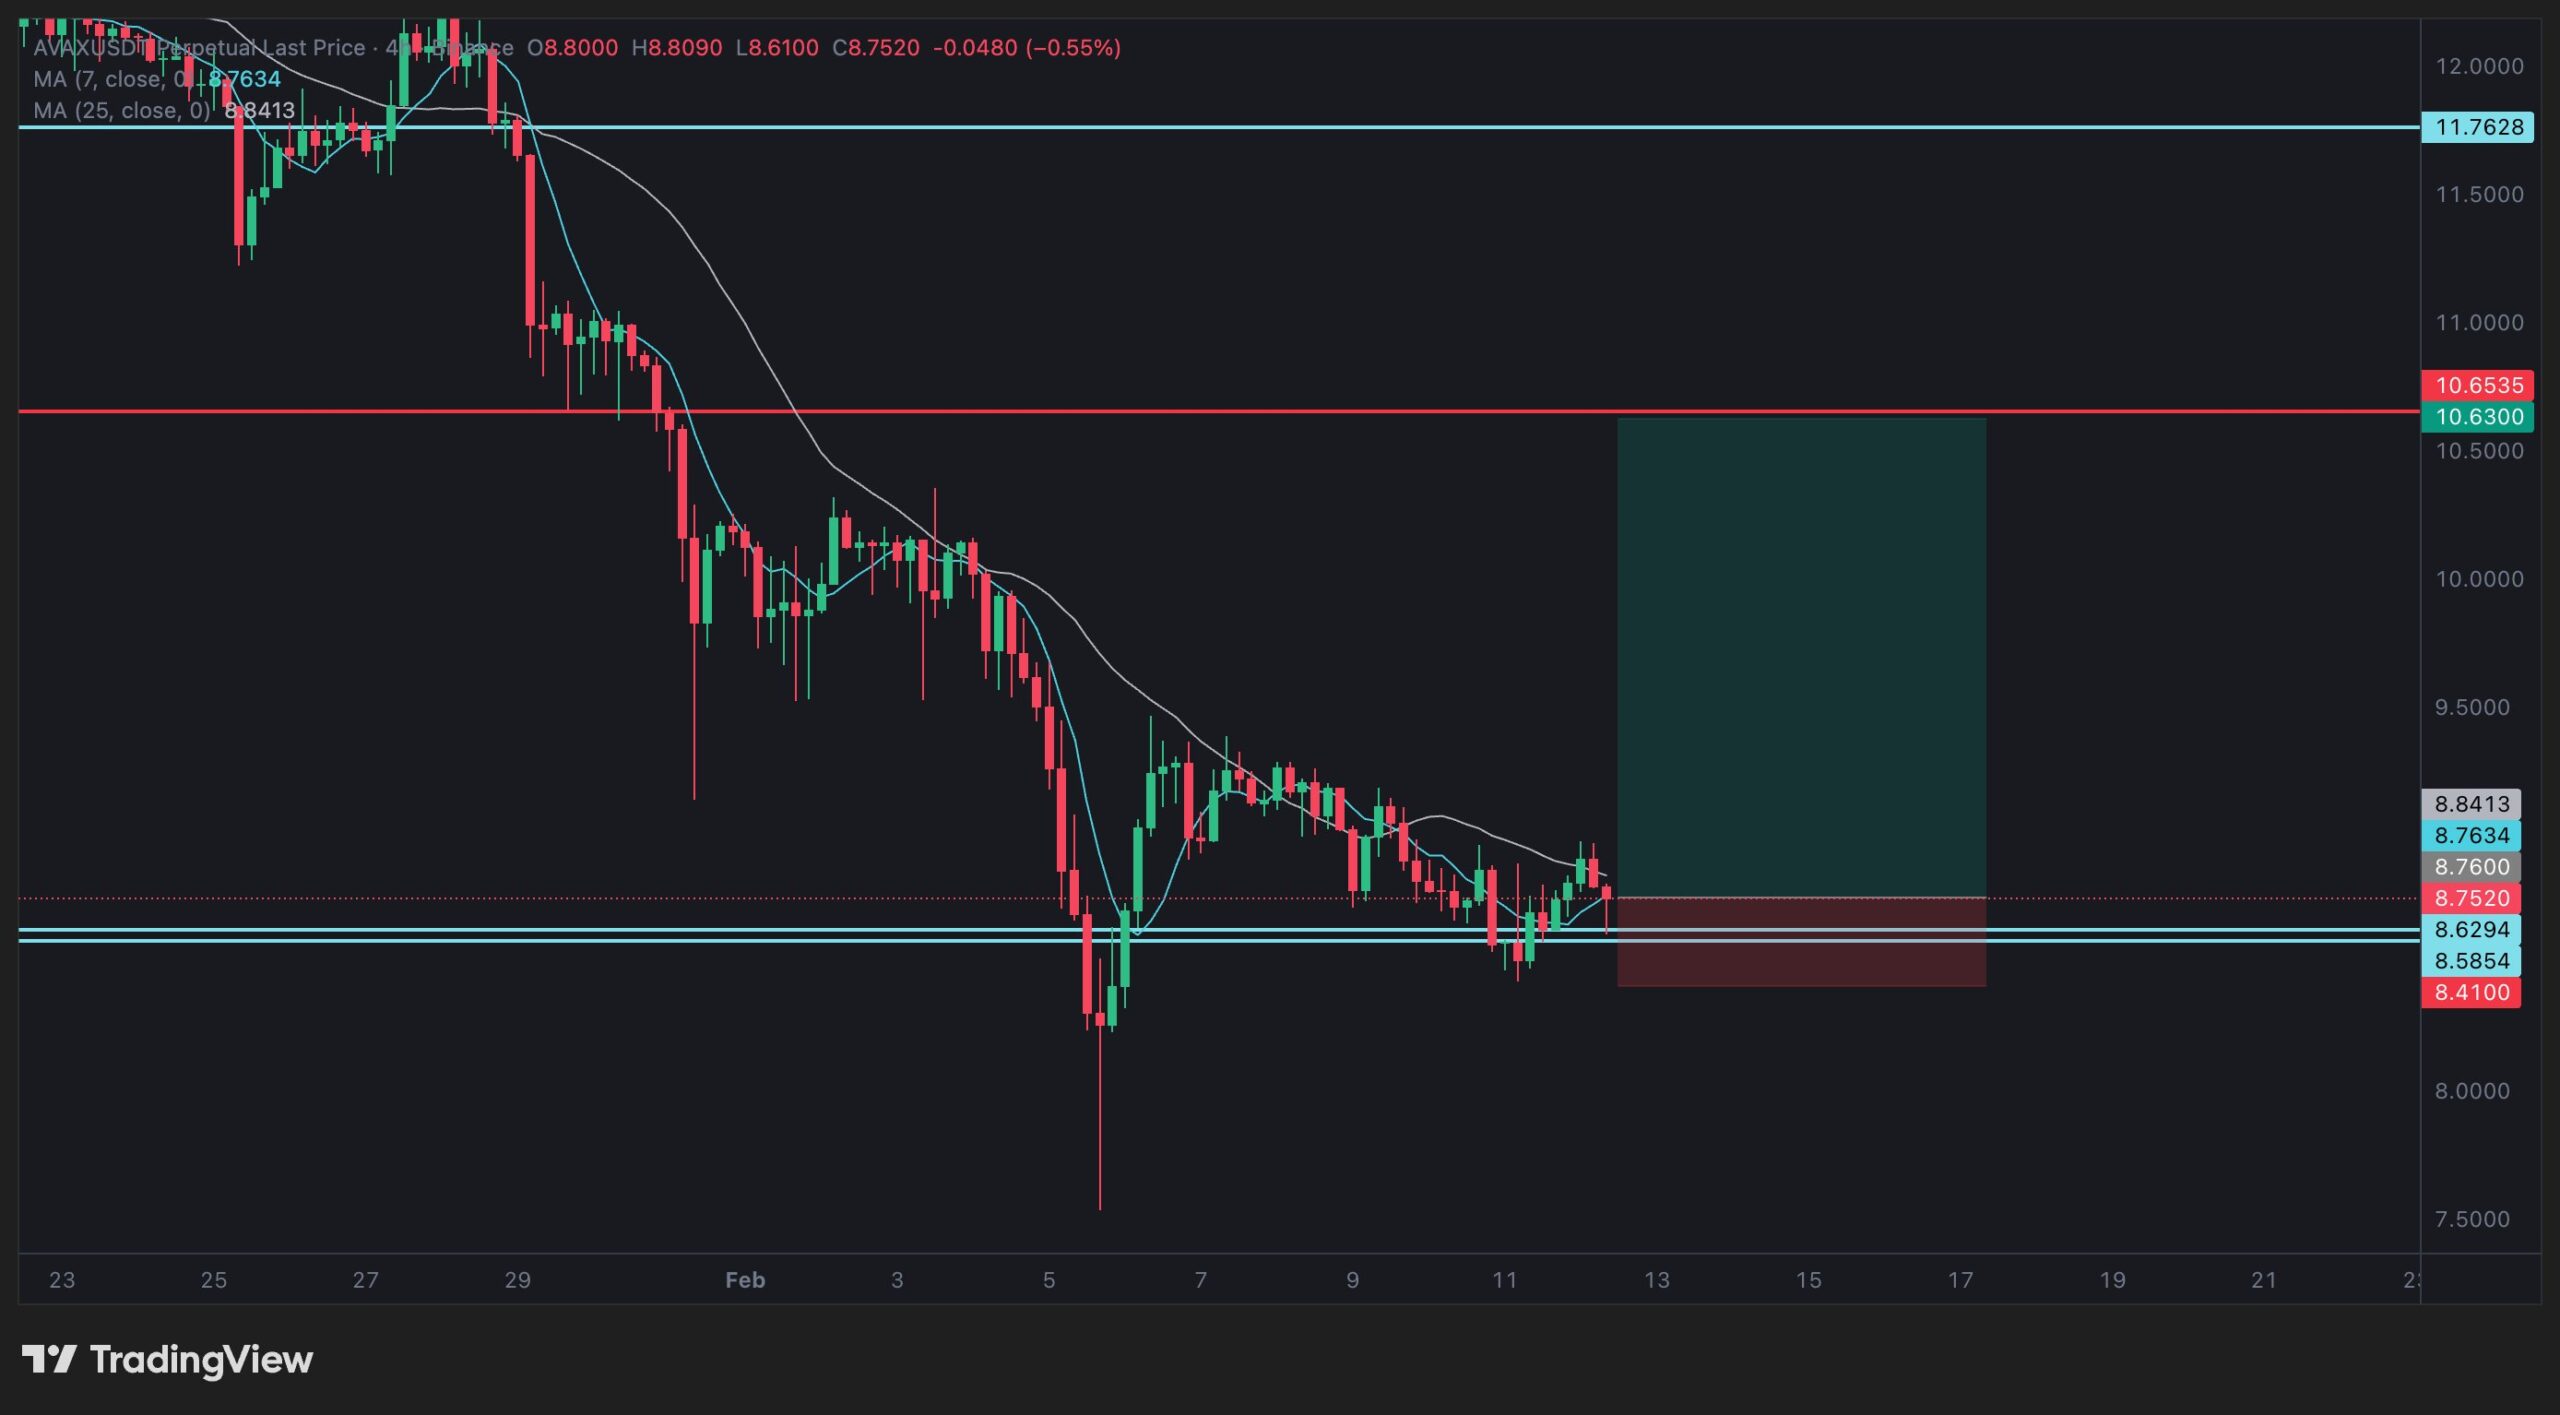
The sequence of lower highs remains intact. After the late January slide from the $11 to $12 area, AVAX attempted several rebounds.
However, each push stalled near the declining moving averages. That behavior confirms trend resistance overhead and keeps the market in a downtrend.
In addition, price continues to print below the red resistance band near $10.63, which marks the prior breakdown zone.
At the same time, price sits on a narrow support area around $8.60 to $8.85, shown by the light blue horizontal line.
Buyers defended this zone several times during the past sessions.
However, the bounces from this level stayed shallow, which signals weak follow through. Until AVAX reclaims the $8.85 to $9.20 area and holds above it, downside pressure remains the dominant force.
The chart also maps a potential upside path toward the first green resistance zone near $10.63 to $10.65.
However, that move would require a clear break above the short term moving averages and a close above the recent lower high cluster near $9.30 to $9.50.
Without that shift, price action continues to favor continuation of the broader downtrend rather than a sustained reversal.
Disclosure:This article does not contain investment advice or recommendations. Every investment and trading move involves risk, and readers should conduct their own research when making a decision.
Kriptoworld.com accepts no liability for any errors in the articles or for any financial loss resulting from incorrect information.

Tatevik Avetisyan is an editor at Kriptoworld who covers emerging crypto trends, blockchain innovation, and altcoin developments. She is passionate about breaking down complex stories for a global audience and making digital finance more accessible.
📅 Published: February 13, 2026 • 🕓 Last updated: February 13, 2026
