")
Bitcoin is showing signs of a potential price surge, suggesting it could reach $127,000 soon.
This seems quiet unbelivable, as the cryptocurrency’s weekly chart remains red, but some indicators say price might be gearing up for a major jump. LFG!
Bullish flag
Bitcoin’s price fell by nearly 5% over the past week and was trading at around $66,000, but now fresh data indicates that Bitcoin is moving within a textbook bullish flag pattern, which could drive its price to new highs.
Gert van Lagen, a well-known crypto analyst, tweeted that the recent price drop might be due to Bitcoin consolidating within a bullish flag pattern.
He noted that Bitcoin had successfully tested its support level, suggesting a potential bull rally that could push its price to $127,000 in the coming weeks or months.
Indicators indicate
Given that reaching $127,000 soon seems unlikely, as we’re talking about an almost 100% rise in weeks, let’s see Bitcoin’s metrics for short-term expectations.
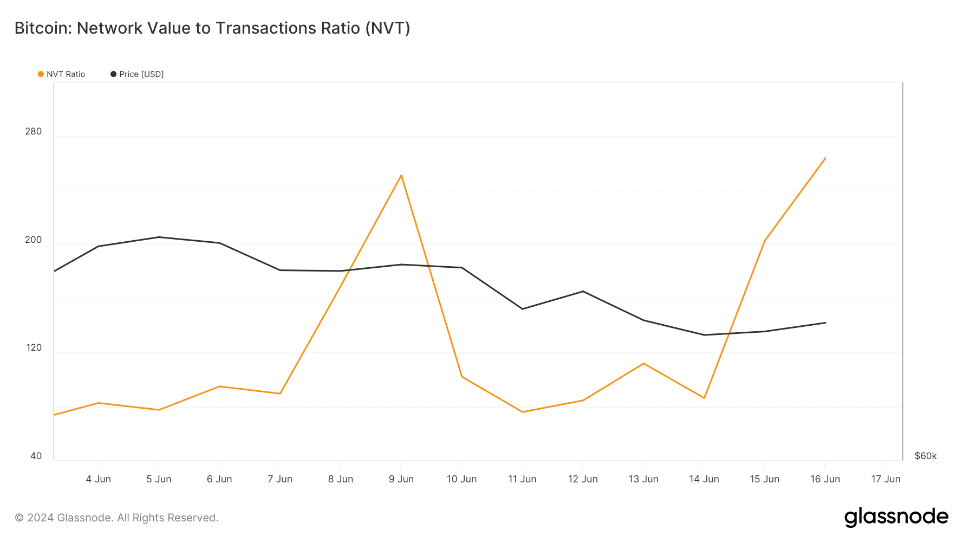
Glassnode’s data showed a sharp increase in Bitcoin’s NVT ratio, meaning the asset might be overvalued and this suggest a price drop in the near future.
CryptoQuant’s data revealed that Bitcoin’s net deposits on exchanges were higher than the seven-day average, this also signaling higher than usual selling pressure.
Bitcoin’s aSORP was red, meaning more investors are selling at a profit, which could indicate a local market top in a bull market.
Three indicators say drop is coming, what $127K? Not a nice look, right?
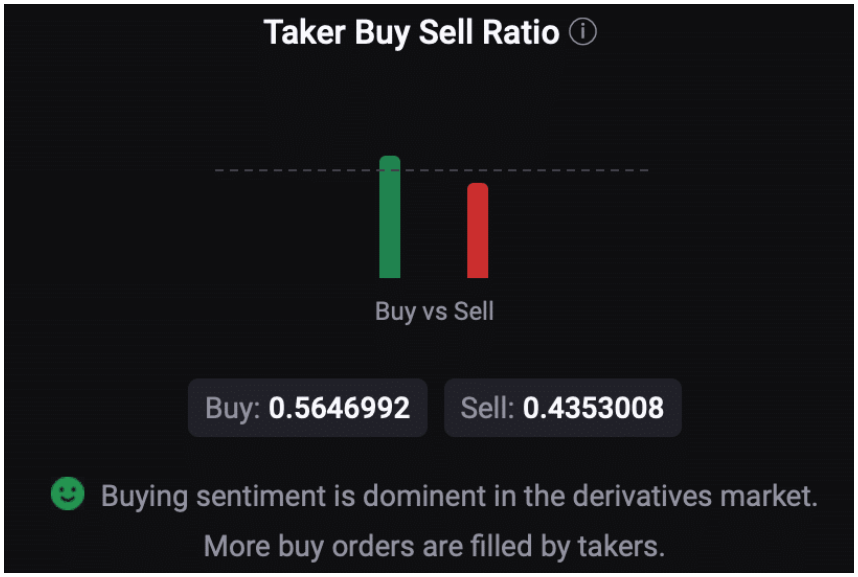
On a positive note, the derivatives market showed a dominant buying sentiment among futures traders, as indicated by the taker buy/sell ratio. But market indicators still remained bearish.
Bitcoin’s Relative Strength Index (RSI) and Chaikin Money Flow (CMF) both showed downward trends, staying below their neutral marks, and the MACD also indicated a bearish phase, hinting at more price declines.
Target levels
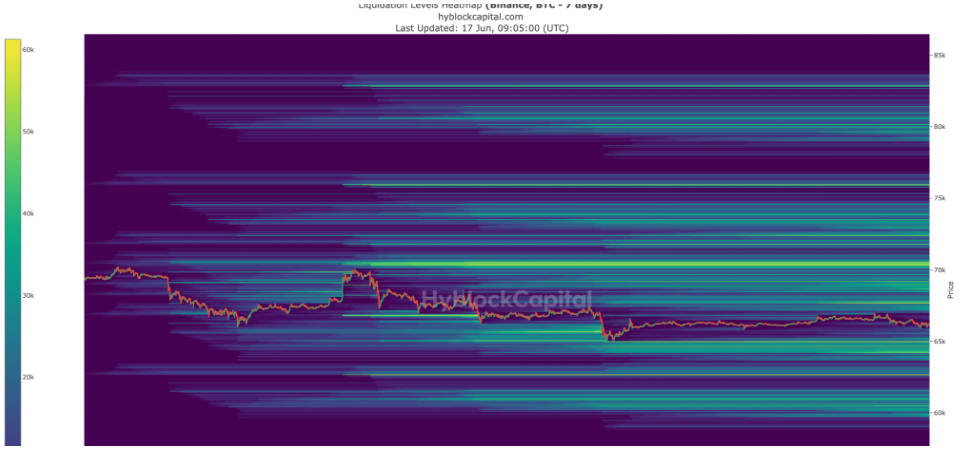
Analysts think if Bitcoin continues its bearish trend, it might drop to $65,000 this week, which would be horrible, truly horrible.
Just kidding, it’s a nothinburger. There were jokes all around social media for years, as we will cry when price will crash to $60K.
But a further decline below this level could see Bitcoin falling to $60,000 in the coming days.
We can speculate that the market’s direction will heavily depend on how these indicators play out and whether the bullish flag pattern materializes or not. Time will tell.