


ADAUSD prints a bullish flag on the weekly chart because price surged into a local peak, then pulled back in a tight, downward sloping channel that keeps consolidation contained.
A bullish flag pattern is a continuation setup where price rallies first, then pauses in a small falling channel, and later resumes the prior uptrend after a breakout.
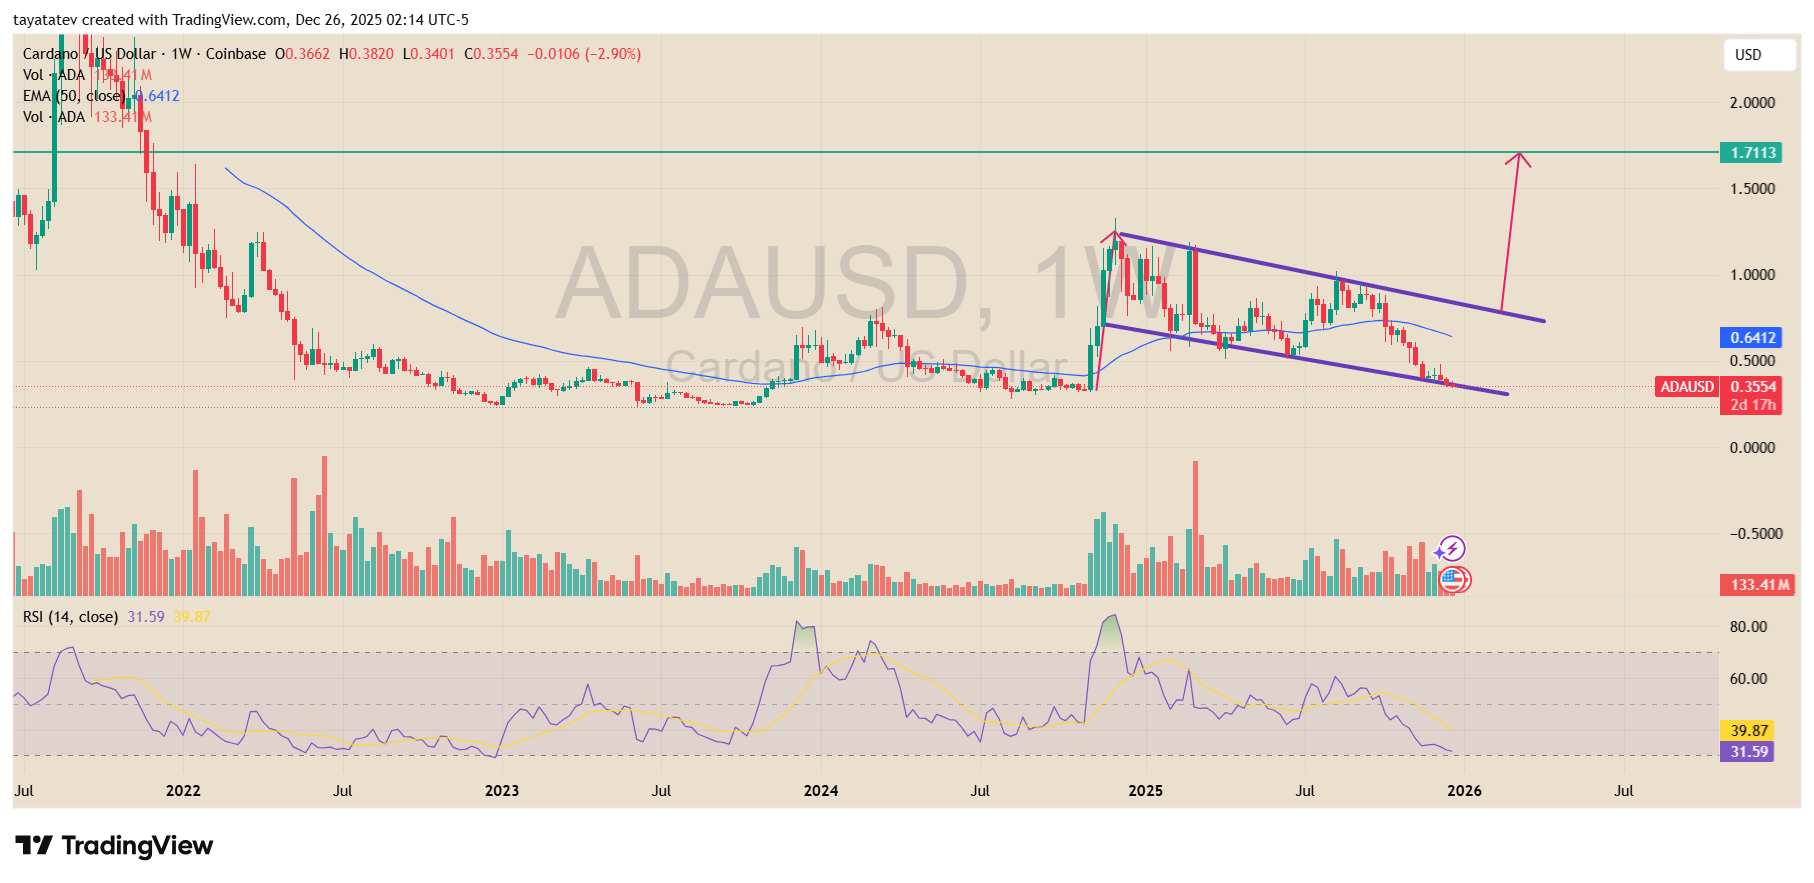
Here, the purple lines outline the “flag” as ADA trends lower but stays inside parallel support and resistance, which keeps the structure organized instead of breaking into a new downtrend.
Meanwhile, ADA trades near $0.3554, and the 50 week EMA sits near $0.6412, so price still holds below a key trend filter.
At the same time, the RSI panel shows RSI (14) near 31.6, which signals weak momentum during the pullback.
Volume also looks heavier around earlier impulse candles, and then it cools during the flag, which often matches how flags form when the market pauses after a strong move.
However, the flag only confirms if ADA breaks above the upper flag trendline and holds it on a weekly close.
If that breakout confirms, then a 375% move from $0.3554 implies a target near $1.69 (0.3554 × 4.75), which also sits close to the chart’s marked upside area around the $1.71 level.
Stay ahead in the crypto world – follow us on X for the latest updates, insights, and trends!🚀
ADAUSDT Faces Critical Test Near 0.2980 Support
ADAUSDT trades just above the 0.2980 support, which now acts as a structural pivot on the higher timeframe.
Price continues to compress inside long-term converging trendlines, showing reduced volatility and limited follow-through from buyers.
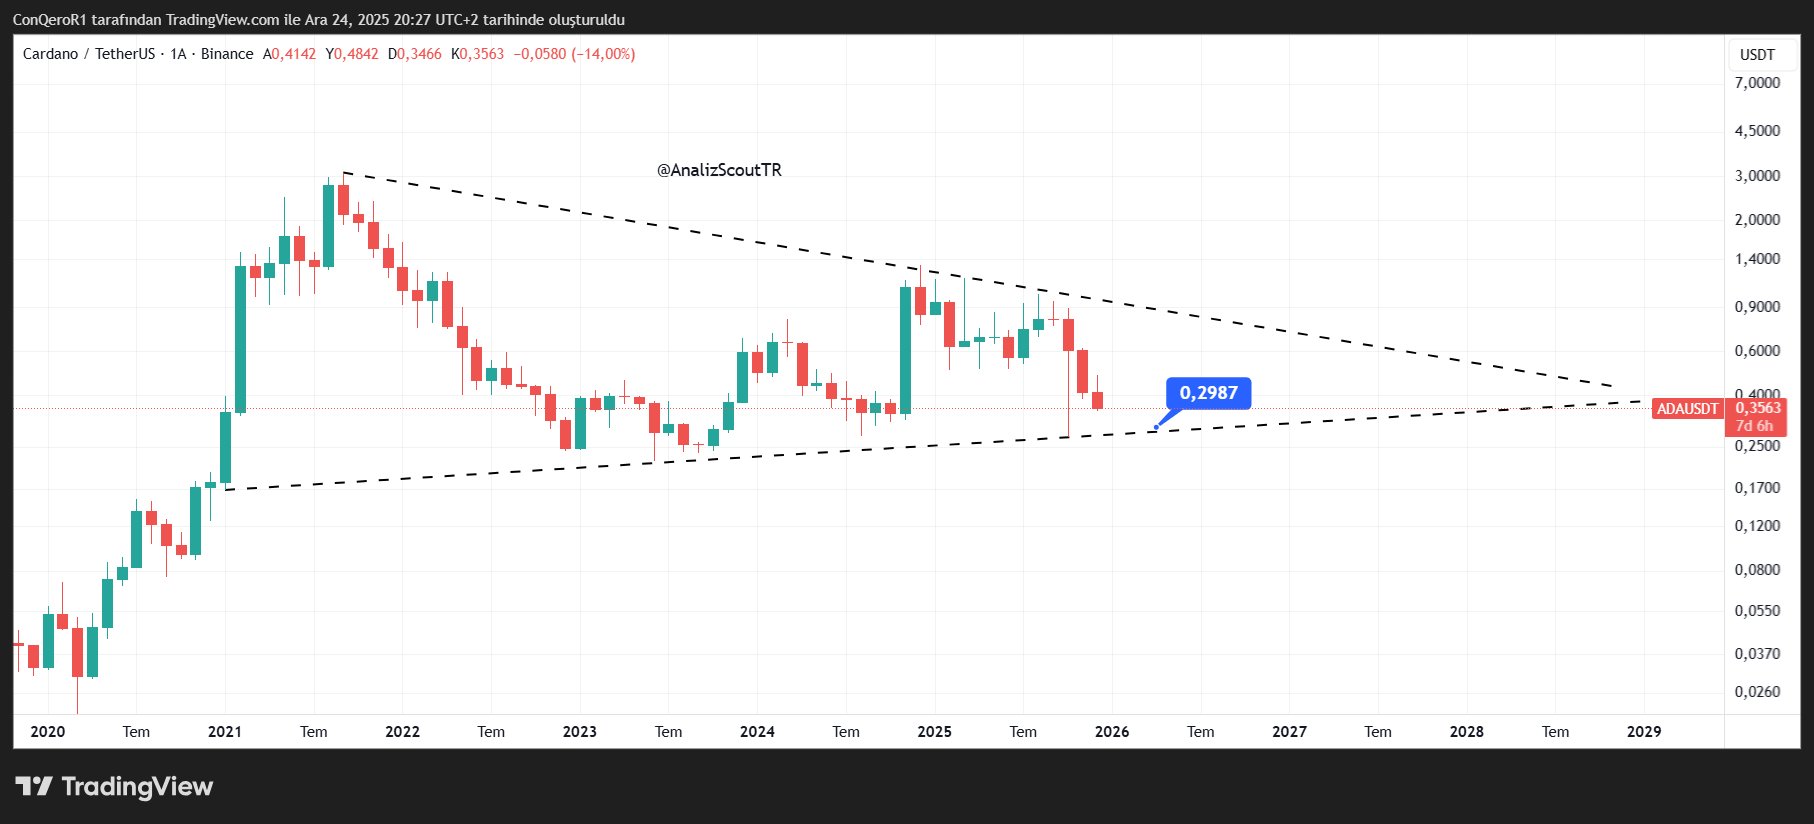
If ADA closes below 0.2980, the structure weakens because price would lose the rising lower boundary of the formation.
In that case, downside risk expands toward the 0.25–0.22 zone, where prior demand clustered during earlier consolidation phases.
That move would also confirm continued lower-high pressure under the descending resistance line.
However, if ADA holds 0.2980 and rebounds, price may rotate higher within the range and retest the 0.36–0.40 area.
That zone aligns with prior breakdown levels and the mid-range of the long-term structure, making it the first upside checkpoint rather than a trend reversal signal.
Disclosure:This article does not contain investment advice or recommendations. Every investment and trading move involves risk, and readers should conduct their own research when making a decision.
Kriptoworld.com accepts no liability for any errors in the articles or for any financial loss resulting from incorrect information.

Tatevik Avetisyan is an editor at Kriptoworld who covers emerging crypto trends, blockchain innovation, and altcoin developments. She is passionate about breaking down complex stories for a global audience and making digital finance more accessible.
📅 Published: December 26, 2025 • 🕓 Last updated: December 26, 2025
