


A chart shared by X account Castillo Trading compares Solana’s 2021 breakout structure with the current market range and argues the setups look similar.
The post says the trader missed SOL in 2021 after expecting a “for sure” retest near $8, because the move looked too obvious at the time.
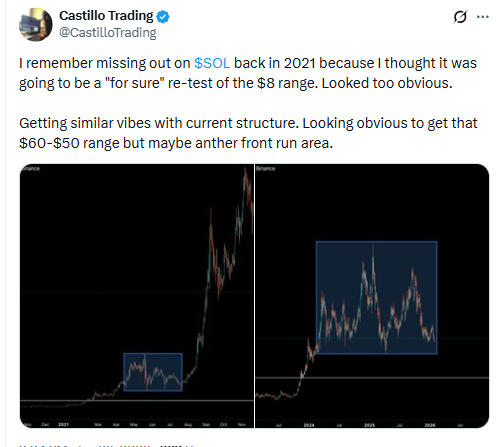
Now, the account says the present structure again makes a downside move look clear, with the $60 to $50 area framed as the likely target zone.
Based on that view, price action could continue to drift lower into that range as the market tests a deeper support band.
At the same time, the post suggests SOL may not deliver the clean move many expect.
Instead, it could “front run” the drop, meaning it could bounce before reaching $60 to $50 if bids step in earlier and sellers fade.
Stay ahead in the crypto world – follow us on X for the latest updates, insights, and trends!🚀
Solana liquidation heatmap points to pressure bands above and below price
A 24 hour Binance SOL USDT liquidation heatmap shows dense leverage clusters forming on both sides of current price, highlighting areas where forced liquidations could accelerate the next move.
The brightest bands appear above the market near the mid $120s, suggesting a concentration of short liquidations that could trigger a sharp upside move if price pushes higher.
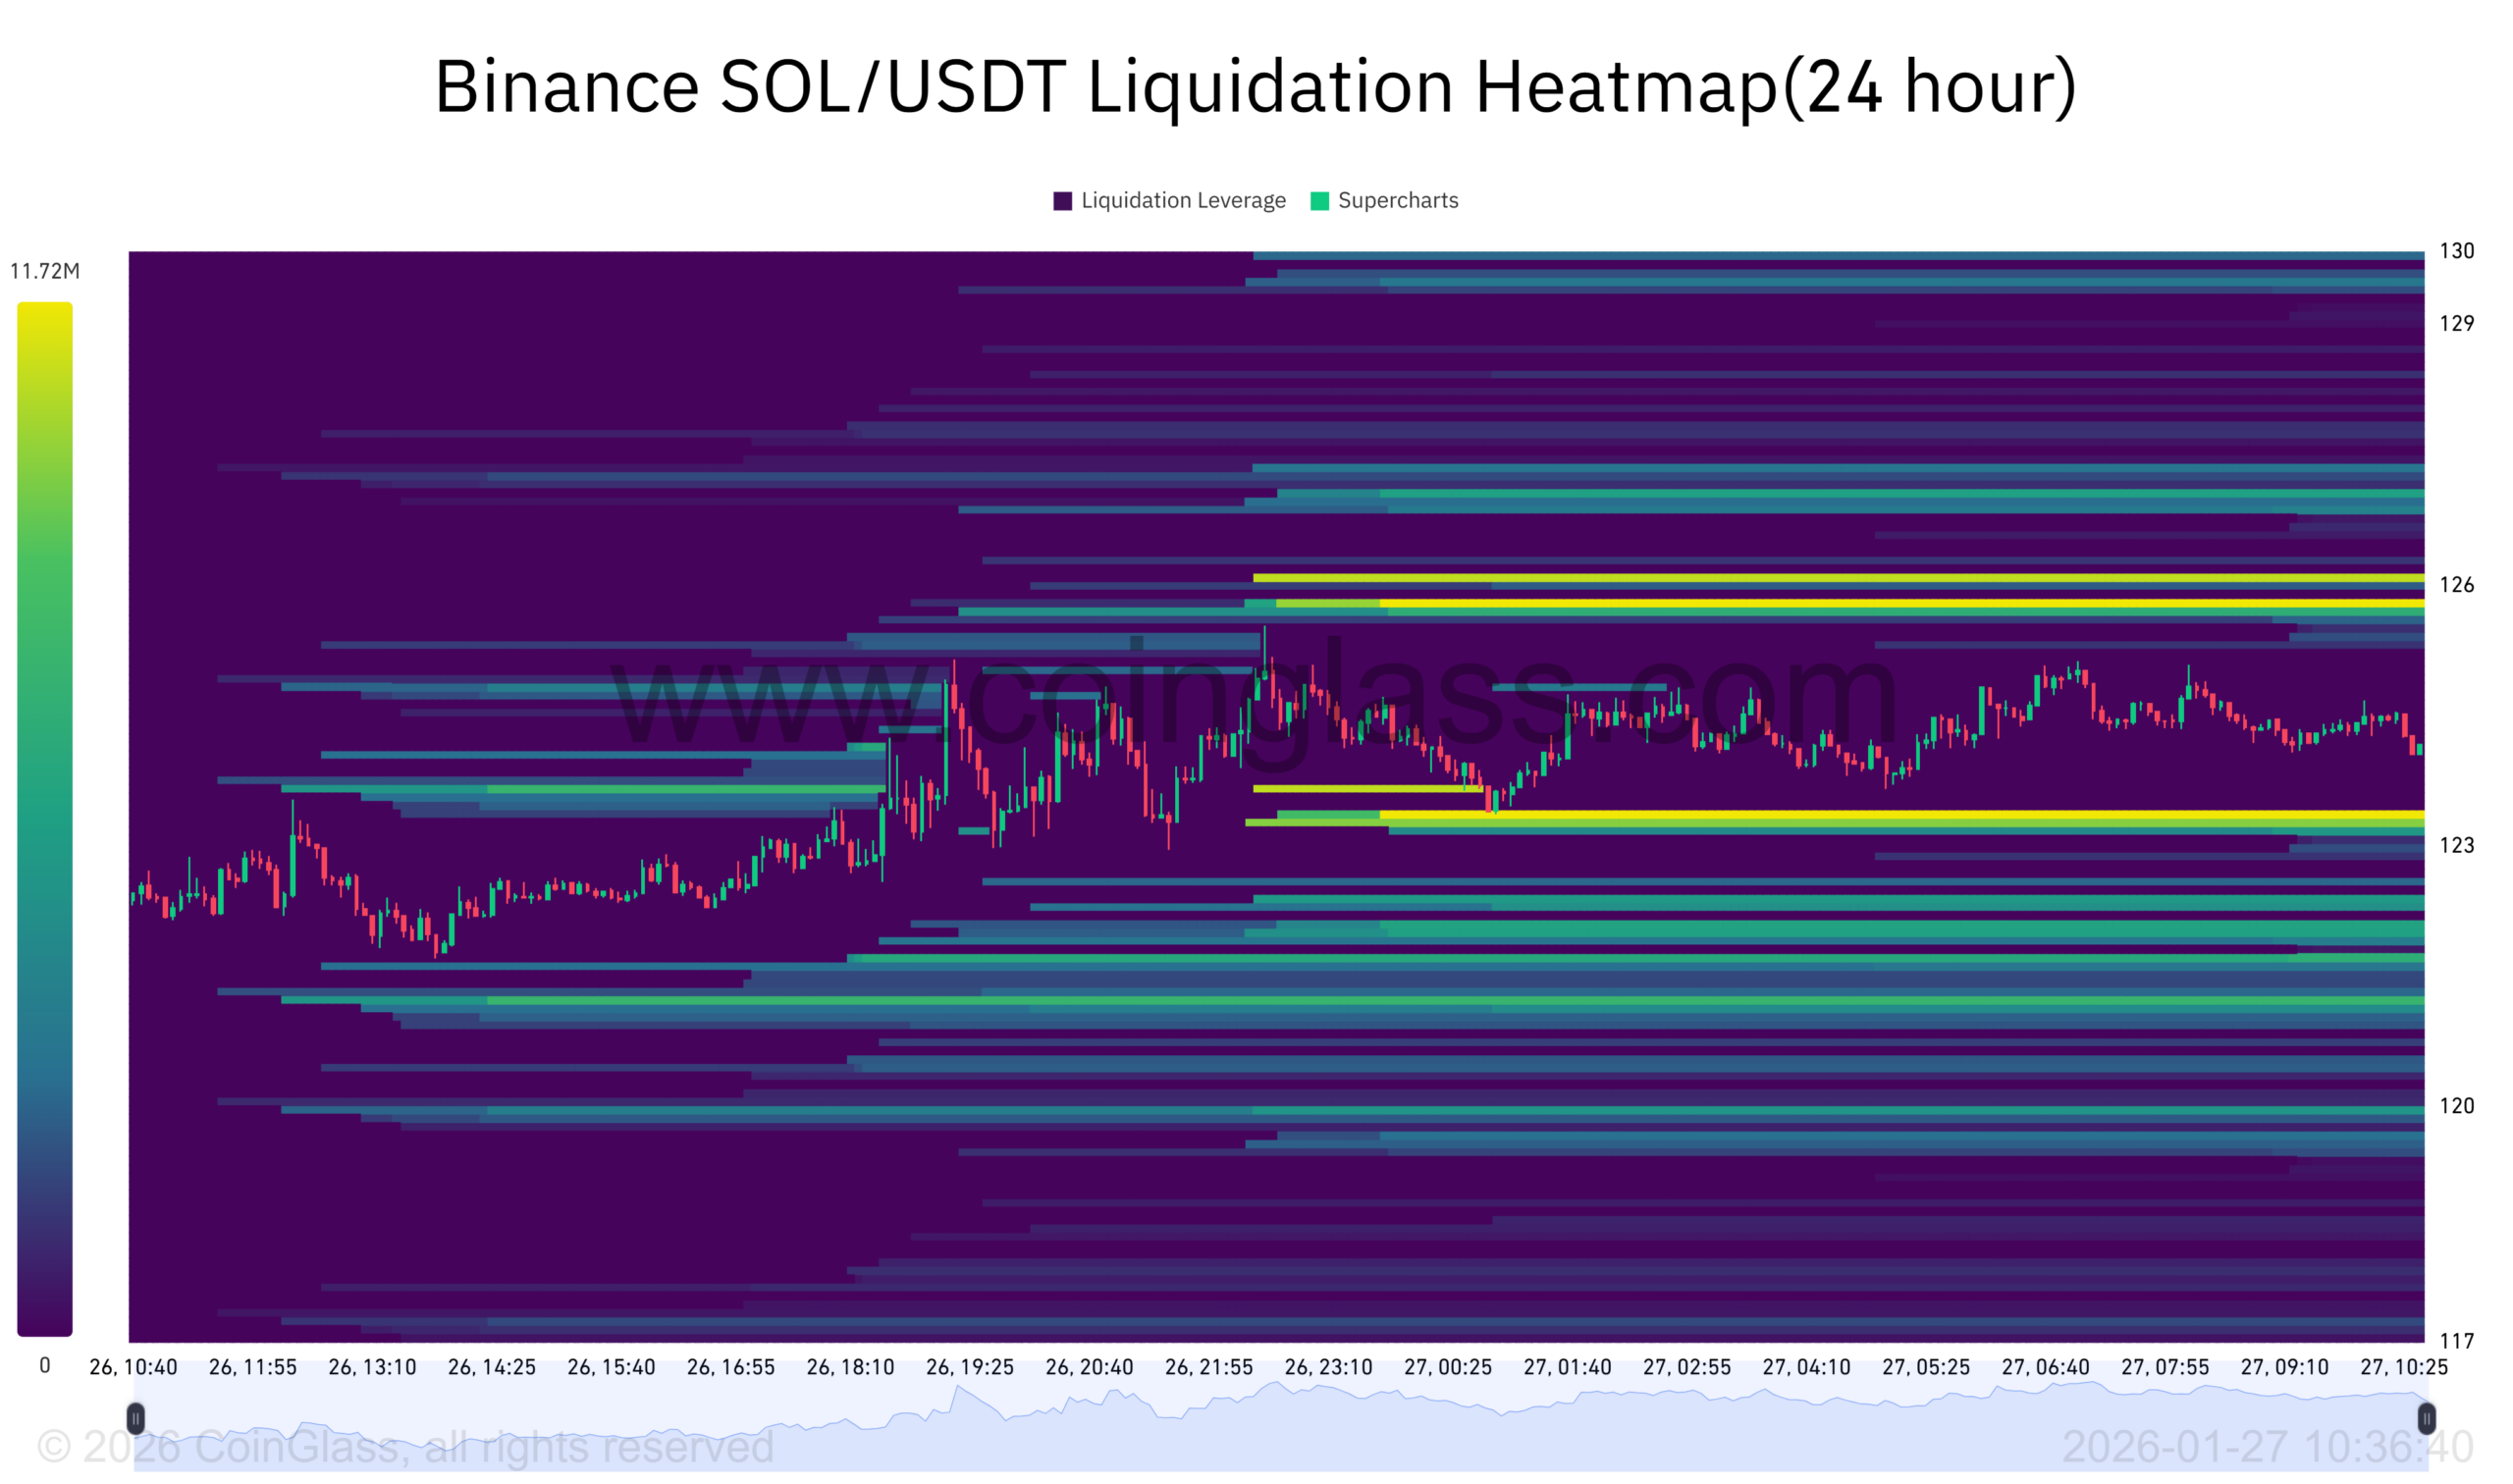
At the same time, notable liquidity also sits below spot, especially in the low $120 and high $110 areas.
This positioning indicates that a downside move could still sweep long leverage before any sustained rebound.
As a result, price remains vulnerable to short term volatility as the market hunts these liquidity pockets.
Overall, the heatmap suggests Solana is trading inside a liquidation corridor.
A break toward either side could prompt a fast move as leverage unwinds, with the strongest reaction likely once one of the highlighted bands is cleared.
Disclosure:This article does not contain investment advice or recommendations. Every investment and trading move involves risk, and readers should conduct their own research when making a decision.
Kriptoworld.com accepts no liability for any errors in the articles or for any financial loss resulting from incorrect information.

Tatevik Avetisyan is an editor at Kriptoworld who covers emerging crypto trends, blockchain innovation, and altcoin developments. She is passionate about breaking down complex stories for a global audience and making digital finance more accessible.
📅 Published: January 27, 2026 • 🕓 Last updated: January 27, 2026
