


Bitcoin hit a new ATH above $100k on December 5, but the excitement was short-lived as the price quickly corrected to around $90.5k a few hours later.
Of course, short after that we got the ATH again. Now experts think despite these fluctuations, the bull run is just getting started.
What’s the Bitcoin Rainbow Chart saying?
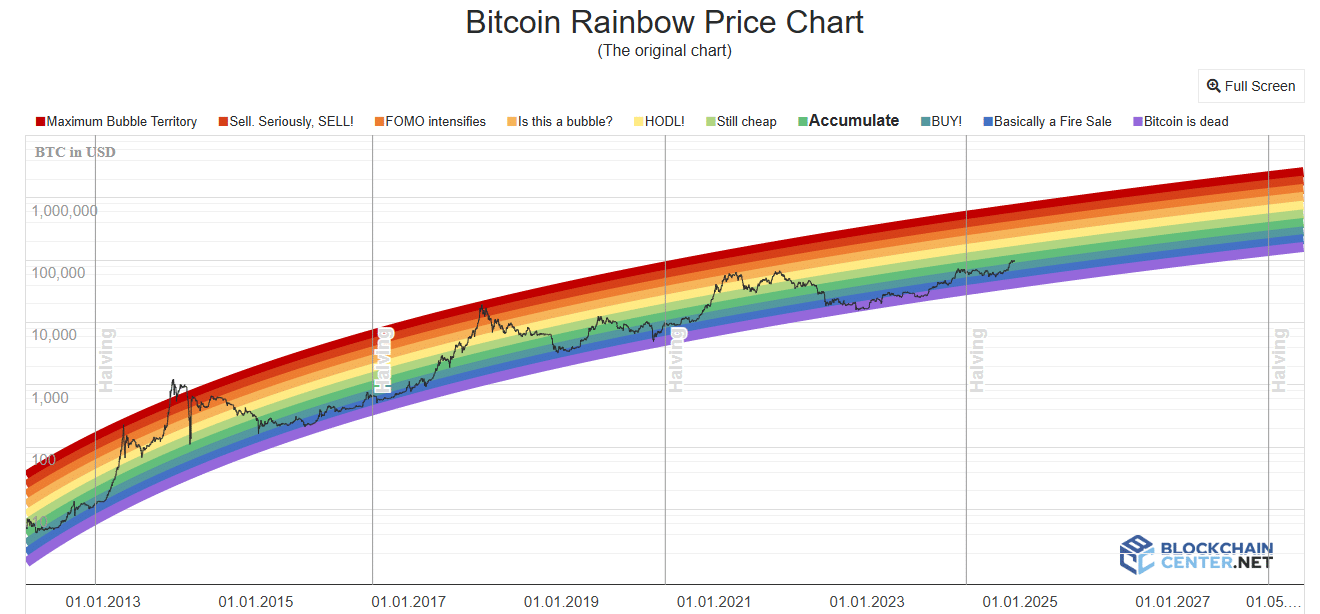
As of now, Bitcoin is still hanging out in the accumulate zone on the Bitcoin Rainbow Chart. This is great news since breaking through the $100k barrier is a big psychological milestone for investors and traders.
Back in early December 2020, in the previous halving cycle, Bitcoin was also in the accumulate zone, priced at $19k. Fast forward six weeks, and it nearly doubled to $36k, entering the HODL! yellow zone.
If history repeats itself, we could see Bitcoin reach $200k in the next six weeks. Sweet dreams, but let’s be real, Bitcoin doesn’t always skyrocket that quickly, so that prediction might be a little bit optimistic.
Keep it real
If we temper our expectations a little, the Bitcoin Rainbow Chart suggests BTC could realistically hit $150k in about six weeks.
If we reach that HODL! yellow band by March, we might even see prices jump to $217k.
Looking back at previous cycles, we saw peaks in December 2017 and again in April and November 2021, and it’s possible this cycle could take its time too, pushing things out to May 2026 or beyond.
If that happens, it would be a long-term bullish sign for Bitcoin since the Rainbow Chart predicts even higher prices over the next 18 months.
Market is unpredictable
One thing is clear, Bitcoin still has a long way to go before hitting its targets this cycle. So investors should prepare for a wild ride ahead!
With all this volatility and potential for growth, it’s an exciting, historical time to be following Bitcoin, no matter what the actual price is.
