


Alright, the financial world’s been buzzing, and Bitcoin? Oh, it’s playing a game of cat and mouse with the market chaos, and right now, it’s winning. Inflation’s cooling off, but not enough to make the Fed drop their guard.
Still, Bitcoin’s got that fire burning, eyeing a $200,000 jackpot like a prizefighter stalking the ring.
Better than expected
So, May’s Consumer Price Index barely budged, just a tiny 0.1% rise. Year-over-year, inflation’s sitting at 2.4%, which is a bit cooler than the hot mess we expected.
Even the core inflation, the one that ignores food and energy prices, came in lighter than the experts’ crystal balls predicted, at 0.1% for the month and 2.8% annually.
And get this, apparel prices, which everyone thought would skyrocket thanks to tariffs? They actually dropped.
That’s four months straight of inflation playing it cool. But don’t pop the champagne just yet, 2% is the Fed’s holy grail, and inflation’s still above that, so no rate cuts are on the menu, despite some political noise from the big guy upstairs, President Trump.
Happy hour for the investors?
Now, Bitcoin’s got the swagger of a long-term champ. The charts? They’re singing a bullish tune, and we all love that.
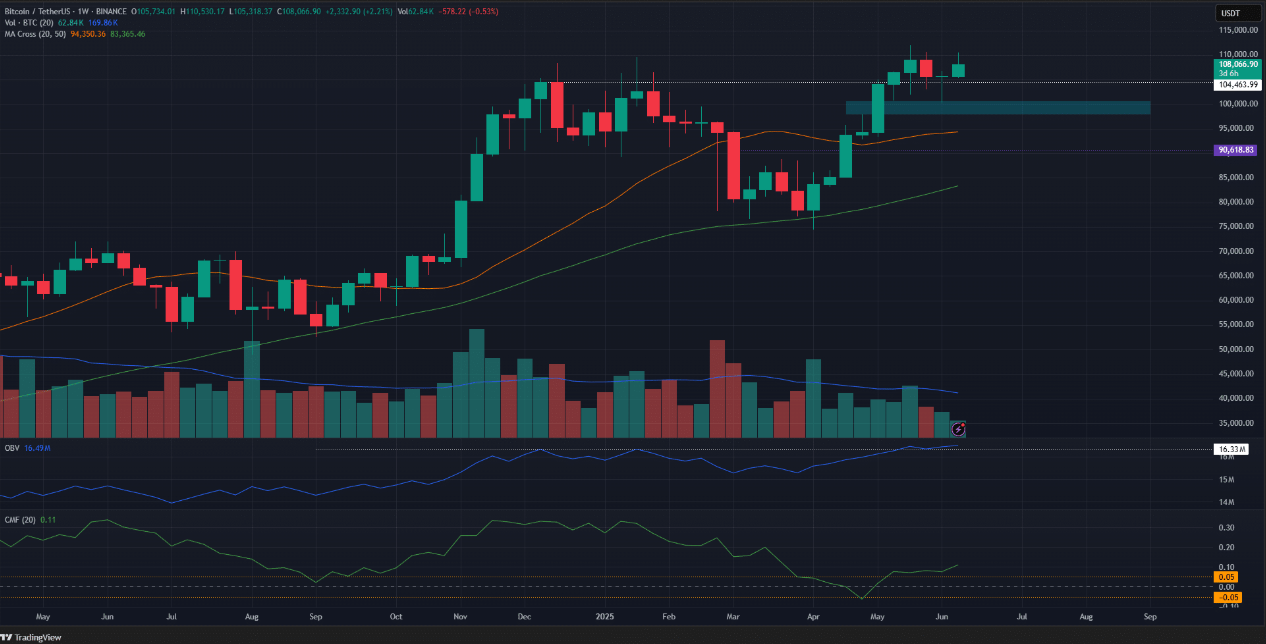
Weekly price action is hanging out above the 20 and 50-week moving averages, basically the technical equivalent of a heavyweight champ’s corner.
The OBV indicator just smashed past its December high, showing that buyers are putting their money where their mouth is.
Related article: Altcoin Surge and Institutional Inflows Push Crypto Market Past $4 Trillion
And the Chaikin Money Flow, the CMF indicator? It’s cruising above +0.05, signaling a flood of capital pouring in like it’s happy hour at the office bar.
When Moon?
Price-wise, Bitcoin just punched through a previous weekly high at $104.4K, setting a fresh target.
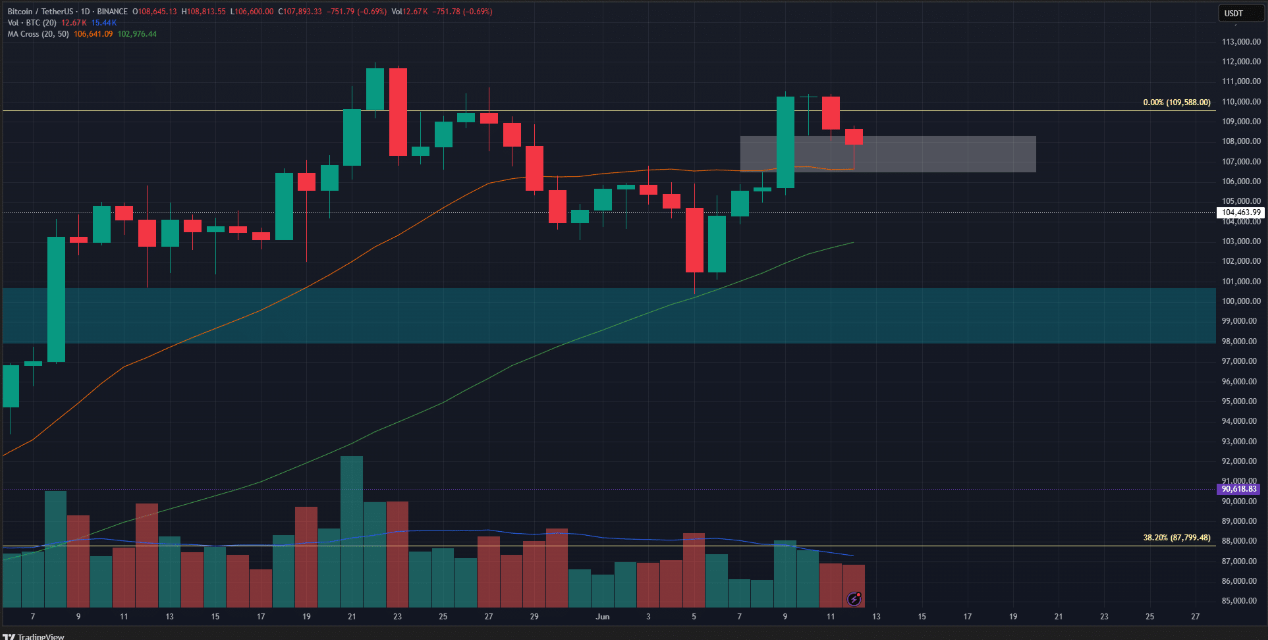
There’s a so-called fair value gap zone between $98K and $100.7K that acted like a safety net earlier this month, think of it as the office’s coffee break spot where everyone regroups before the next big meeting.
But the daily chart’s got a potential trouble zone between $106.5K and $108.3K, and this could be a poblem you know.
Bitcoin tested this area but hasn’t dipped below it yet. If it closes a daily session under $106.5K, that’s the first red flag, and we might see a slide back to the $100K-$102K range. That wouldn’t be fun.
Bottom line? Bitcoin’s gearing up for a possible rocket ride to $200,000. All we want to know is when?
Disclosure:This article does not contain investment advice or recommendations. Every investment and trading move involves risk, and readers should conduct their own research when making a decision.
Kriptoworld.com accepts no liability for any errors in the articles or for any financial loss resulting from incorrect information.
