


In the last 24 hours, BNB’s market cap skyrocketed by over $5 billion, reaching $91 billion. Talk about a glow-up!
Top performer
At the moment, BNB is the star performer among the top ten cryptocurrencies, trading at around $633, its highest price in five months.
But even with this impressive rise, BNB hasn’t quite reclaimed its title as the third-largest non-stablecoin, having recently been overtaken by Solana.
So, what’s driving this rally? For starters, let’s look at buying activity. A look at BNB’s one-day chart shows that buyers are stepping up their game.
The volume have flipped to green, as they say, signaling that buyers are firmly in control.
What does the chart say?
The RSI is looking strong at 66, indicating solid bullish momentum. After crossing above the Signal Line, the RSI has been hitting higher highs, definitely a good sign for those riding the upward wave.
Plus, the Chaikin Money Flow is sitting pretty at a positive 0.08, suggesting that cash is flowing into BNB like it’s happy hour at your favorite bar.
If this buying trend continues, BNB might just test its next resistance level at $652. If it breaks through that barrier, we could see even more gains.
But let’s not get too ahead of ourselves, given that these gains have coincided with typical weekend volatility, there’s a chance we could see a dip back to support at around $585 if traders decide to cash in their profits.
Open Interest signals optimism
As always, it’s not just spot trading that’s buzzing, the derivatives market is also heating up.
Coinglass data shows that BNB’s Open Interest jumped by 27% in just 24 hours, now sitting at $738 million.
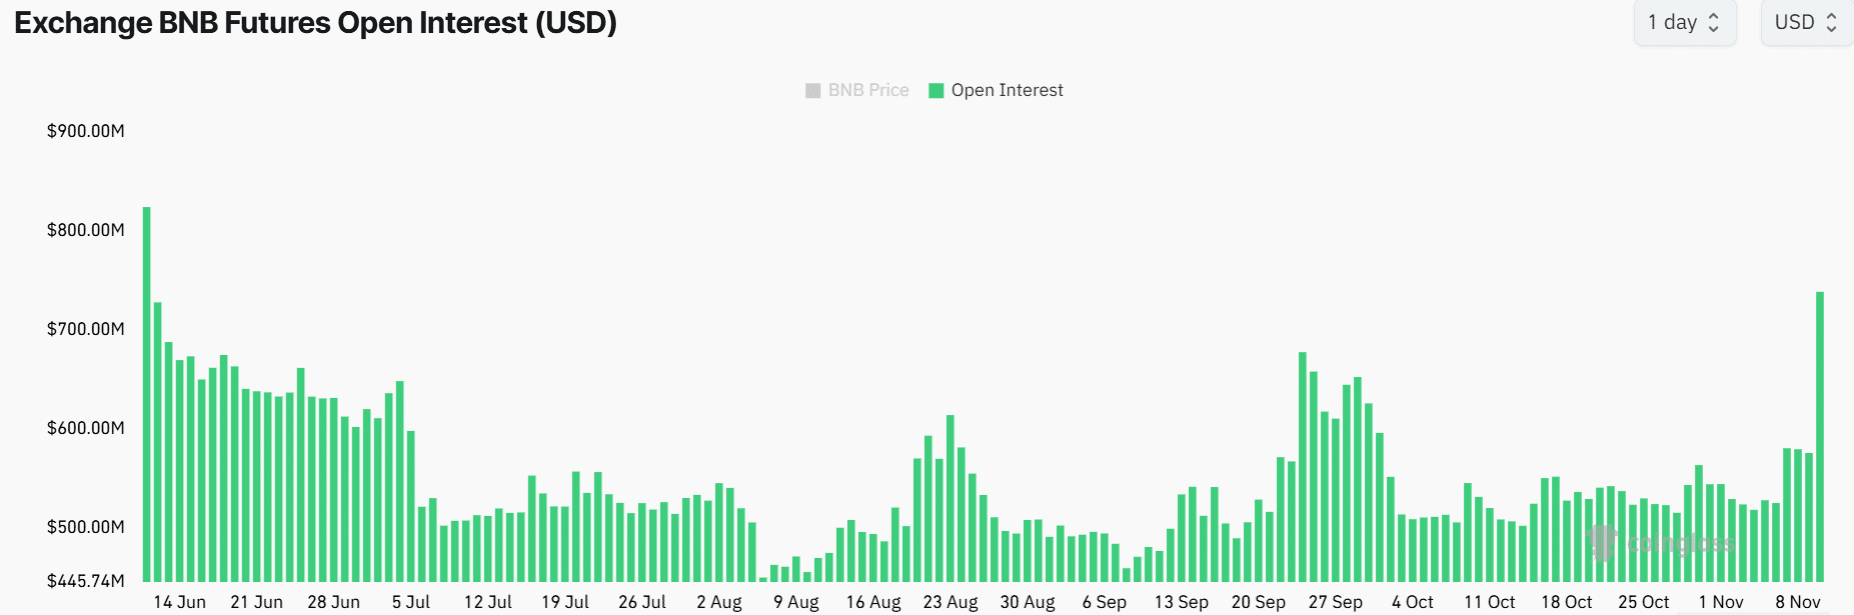
This is the highest OI has been since June, which suggests that traders are getting more serious about their positions in BNB.
When Open Interest rises alongside price increases, it usually means that bullish sentiment is gaining traction. And guess what?
Most of the new positions are coming from long traders, the long/short ratio has climbed from 0.90 to 1.11. Plus, funding rates have been positive over the past week, adding to the optimism.
