


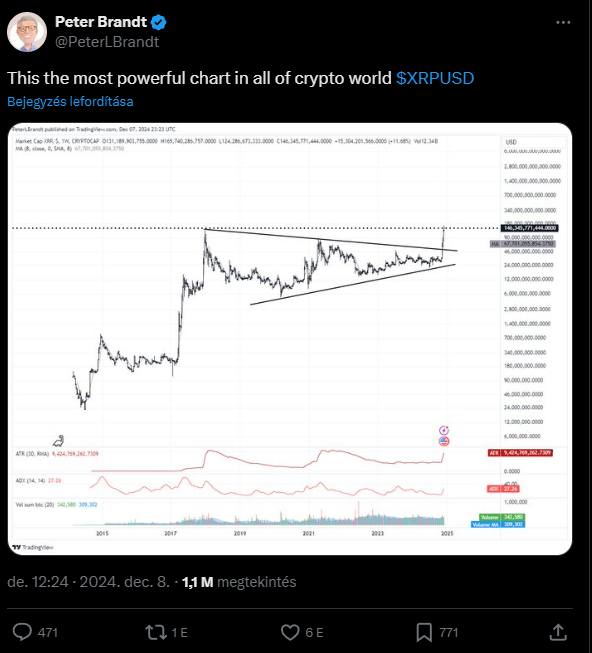
XRP’s market cap inching closer to the $150 billion level, and Peter Brandt just shared what he calls “the most important” chart in the crypto world, showing XRP breaking out of a major triangular consolidation pattern.
XRP’s rally
Brandt seems to think that this breakout could signal a continued rally for XRP, especially now that its market cap already surged above the resistance level of $146 billion.
In the past 24 hours alone, XRP’s price jumped over 6%, significantly outperforming the whole market, and over the past week, it’s up 36%!
But on the other hand, not everyone is cheering for Brandt, because some members of the crypto community have poked fun at him for suddenly changing his tune on XRP after years of skepticism.
Just a few months back, he claimed that the XRP/BTC pair was headed for zero and warned that XRP community members might slowly disappear if a bearish trend continued.
What changed?
Fast forward to last month, and Brandt seemed to flip his stance after XRP had already started its impressive rally, trading at around $1.1.
But here’s the deal, because he clarified that he has no plans to actually invest in XRP and only holds Bitcoin and Solana.
Earlier this month, XRP surged to a multi-year high of $2.8, and it’s now just 25% away from reaching a new ATH after seven long years.
This surge can be attributed to a few factors, including the resignation of SEC Chair Gary Gensler and growing excitement around ETFs.
XRP to the Moon?
As XRP continues to gain traction, many are keeping an eye on how far it can go, and with Brandt’s chart making headlines and analysts buzzing more and more about potential price movements, it looks like we’re in for an exciting ride.
