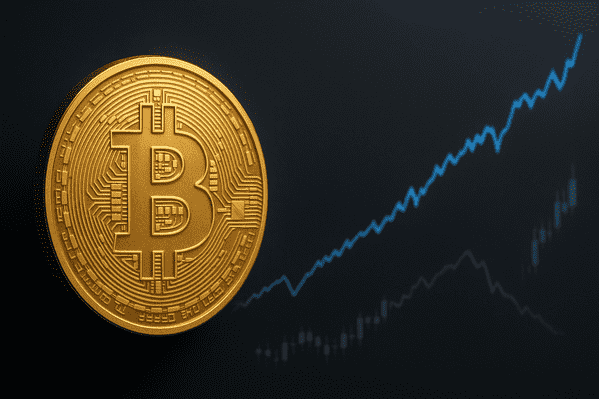
The S&P 500 has surged in dollar terms since 2020. Yet the S&P 500 fell about 88% when measured in Bitcoin. This frames a stark S&P 500 vs Bitcoin gap.
Phil Rosen highlighted this on Oct. 5. He is the cofounder of Opening Bell Daily. His X post priced the S&P 500 in Bitcoin units over time.
The method divides the S&P 500 level by the Bitcoin price. Therefore, when Bitcoin rises faster, the S&P 500 declines in BTC terms. The chart shows that effect across this cycle.
Stay ahead in the crypto world – follow us on X for the latest updates, insights, and trends!🚀
Warren Buffett, S&P 500 indexing, and the Bitcoin lens
Warren Buffett often points average investors to the S&P 500. He has praised simple, low-cost indexing for decades. Public remarks and letters reflect this steady message.
Historical S&P 500 data backs the long view. Since 1957, the S&P 500 returned about 6.68% per year after inflation. That often beats average United States inflation.
Buffett has also cited a 90/10 approach. That is 90% in an S&P 500 index fund and 10% in short-term United States Treasuries. The S&P 500 remains the core in that split.
S&P 500 record highs vs Bitcoin record highs in 2025
The S&P 500 set new highs in 2025. Recent prints show 6,715.79, up 14.43% year to date. That marks a strong year for large-cap stocks.
Bitcoin also posted a record this week. It hit 125,000 dollars on Saturday. Bitcoin is up 32% year to date based on recent levels.
Side-by-side S&P 500 vs Bitcoin returns clarify the scale. S&P 500 gains look steady in dollars. Bitcoin gains compress the S&P 500 when priced in BTC.
OfficialData comparison: $100 in S&P 500 vs Bitcoin
OfficialData offers simple return calculators. They track value growth from a start date to a later date. The tool covers both the S&P 500 and Bitcoin.
A 100-dollar S&P 500 investment from Jan. 2020 reached 209.85 dollars by July 2025. That doubles capital in dollar terms. It matches the long-run S&P 500 profile.
The same 100 dollars in Bitcoin reached 1,473.87 dollars over that span. That dwarfs the S&P 500 result. It explains the 88% S&P 500 decline when measured in BTC.
Measuring the S&P 500 in Bitcoin changes the picture
Quoting the S&P 500 in Bitcoin sets BTC as the unit of account. This flips the usual dollar lens. It highlights relative strength during Bitcoin advances.
Thus, any asset that lags Bitcoin appears weaker in BTC terms. The S&P 500 vs Bitcoin chart captures exactly that. The S&P 500 level buys fewer BTC than it did in 2020.
However, this is a comparative frame, not a forecast. It answers how many Bitcoin the S&P 500 “costs” over time. It does not replace dollar reporting for most investors.
Why the S&P 500 and Bitcoin are not the same thing
The S&P 500 tracks about 500 large United States companies. It updates its members as firms rise or fall. It represents diversified equity exposure with lower daily swings.
Bitcoin is a single digital asset with a fixed issuance path. Its design centers on scarcity and decentralization. It shows higher day-to-day and intraday volatility.
Market size also differs sharply. Recent figures place Bitcoin near 2.47 trillion dollars in market value. The combined value of S&P 500 companies sits near 56.7 trillion dollars.
S&P 500 vs Bitcoin: risk, return, and time frames
The S&P 500 delivered steady, real returns across long horizons. The 6.68% post-inflation figure anchors pension and retirement math. Institutions build around that compounding.
Bitcoin produced large gains across shorter cycles. The 2020–2025 period shows that clearly. Hence the S&P 500 vs Bitcoin gap looks wide in this snapshot.
Time frames shape the story. Multi-decade S&P 500 data smooths shocks and recessions. Shorter Bitcoin cycles can swing more, both up and down.
Sources and dates for S&P 500 vs Bitcoin data
Phil Rosen posted the S&P 500-in-BTC chart on Oct. 5. The visualization priced the index in Bitcoin since 2020. It showed the 88% drop in BTC terms.
OfficialData provided return estimates. The tool produced 209.85 dollars for the S&P 500 case. It produced 1,473.87 dollars for the Bitcoin case.
Recent market dashboards supplied index levels and year-to-date moves. They showed the S&P 500 at 6,715.79 and Bitcoin at 125,000 dollars. The 14.43% and 32% year-to-date figures match those readings.
Disclosure:This article does not contain investment advice or recommendations. Every investment and trading move involves risk, and readers should conduct their own research when making a decision.
Kriptoworld.com accepts no liability for any errors in the articles or for any financial loss resulting from incorrect information.

Tatevik Avetisyan is an editor at Kriptoworld who covers emerging crypto trends, blockchain innovation, and altcoin developments. She is passionate about breaking down complex stories for a global audience and making digital finance more accessible.
📅 Published: October 6, 2025 • 🕓 Last updated: October 6, 2025


