


Hedera’s HBAR traded near 0.2097 on Oct 30, 2025 (4h chart, Coinbase), after a steady climb above the 50 EMA at 0.1861.
The chart shows price moving inside a rising wedge that starts from the Oct 24 low and leans into horizontal resistance near 0.22.
Stay ahead in the crypto world – follow us on X for the latest updates, insights, and trends!🚀
A rising wedge is a pattern where price makes higher lows into a flat or slower-rising ceiling, signaling pressure for a breakout if buyers win.
Here, the upper purple line caps advances, while the lower line is getting steeper, which means demand is chasing price.
Volume also picked up on the right side of the structure, so the move is not only drift. RSI sits above 70, so the market is strong but slightly overheated.
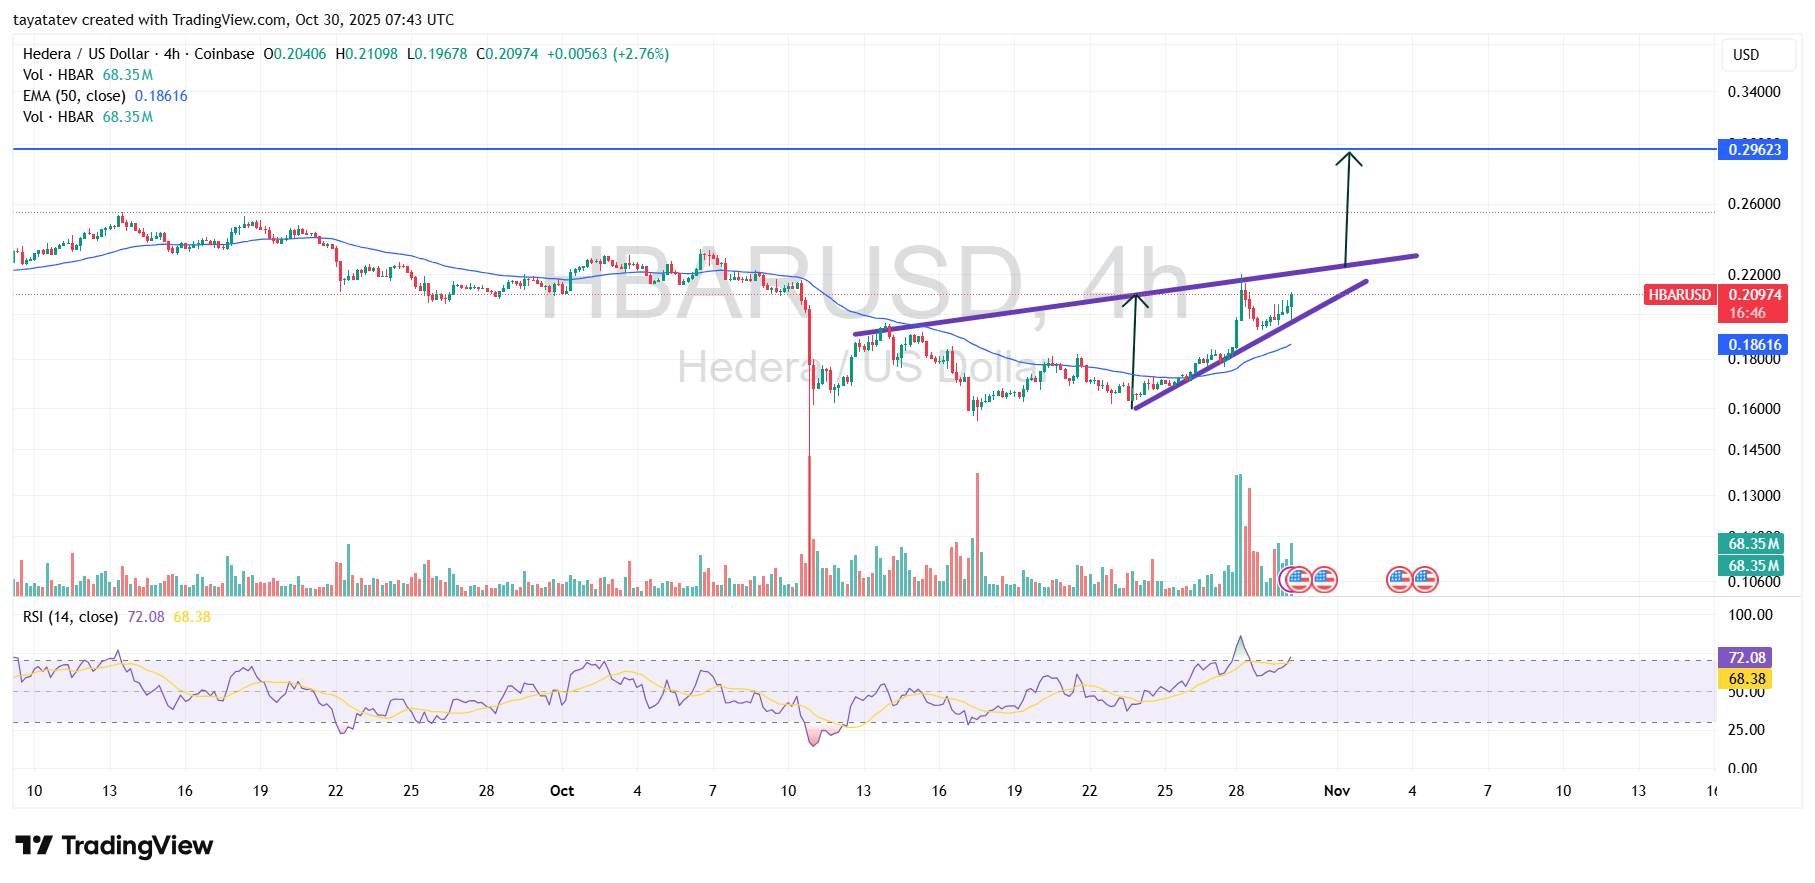
The important level is the wedge top around 0.22. If HBAR closes a 4h candle above that line with volume similar to the Oct 28 spike, the pattern points to a measured move toward the thick blue resistance near 0.296.
That level is about 40 percent above the current 0.2097, so the chart is clearly using the height of the rallying leg and projecting it upward, which fits the markup on the screen.
The reason that target matters is that 0.296 was the previous supply zone on the left of the chart, so it is a natural place for profit taking.
Until the breakout, support stays at the rising lower line and then at the 50 EMA around 0.186; losing both would cancel the bullish read and turn the wedge into exhaustion instead of continuation.
So, if confirmed, HBAR can travel roughly 40 percent up from today’s level to about 0.293–0.296.
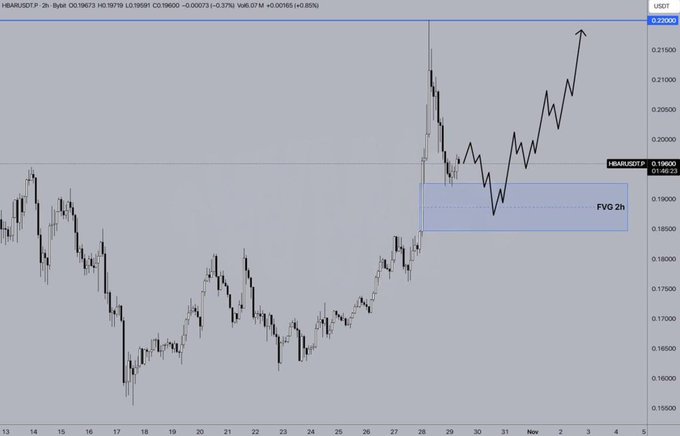
HBAR Correction Targets FVG Zone Before Potential Rebound
On Oct 30, 2025, HBAR traded near $0.195, showing a pullback after its recent surge.
The chart from Jessica Analytics highlights a possible correction phase that may end inside the 2-hour Fair Value Gap (FVG) zone between $0.1847 and $0.1926.
This area acts as a short-term demand region where buyers could re-enter the market.
In technical terms, a Fair Value Gap appears when price moves sharply, leaving an imbalance between buying and selling orders.
It often attracts price back to fill the gap before the trend resumes. Here, HBAR’s sharp rise left such an imbalance, and the ongoing correction seems to be addressing that gap.
If price reacts positively within this blue FVG zone, it could validate the setup for another upward leg toward $0.22, the chart’s key resistance line.
A confirmed bounce would show renewed momentum and align with the larger uptrend seen earlier in the week.
The structure suggests a healthy retracement, not a reversal, as long as HBAR holds above the lower FVG boundary. Once that reaction occurs, traders will watch for higher highs and sustained volume to confirm the continuation toward the $0.22 target.
Disclosure:This article does not contain investment advice or recommendations. Every investment and trading move involves risk, and readers should conduct their own research when making a decision.
Kriptoworld.com accepts no liability for any errors in the articles or for any financial loss resulting from incorrect information.

Tatevik Avetisyan is an editor at Kriptoworld who covers emerging crypto trends, blockchain innovation, and altcoin developments. She is passionate about breaking down complex stories for a global audience and making digital finance more accessible.
📅 Published: October 30, 2025 • 🕓 Last updated: October 30, 2025
