


AAVE just saw a $3 million whale accumulation at the same moment its long-term trendline came under pressure.
The move now places both on-chain flow and chart structure at a decisive point for the token.
Whale Spends $3 Million USDC to Buy Nearly 17,000 AAVE
An on-chain whale used $3 million in USDC to purchase 16,991 AAVE at an average price of $177, according to data from Onchain Lens and Nansen.
The transaction appeared in a series of settlement entries showing repeated swaps between USDC and AAVE through CoW Protocol.
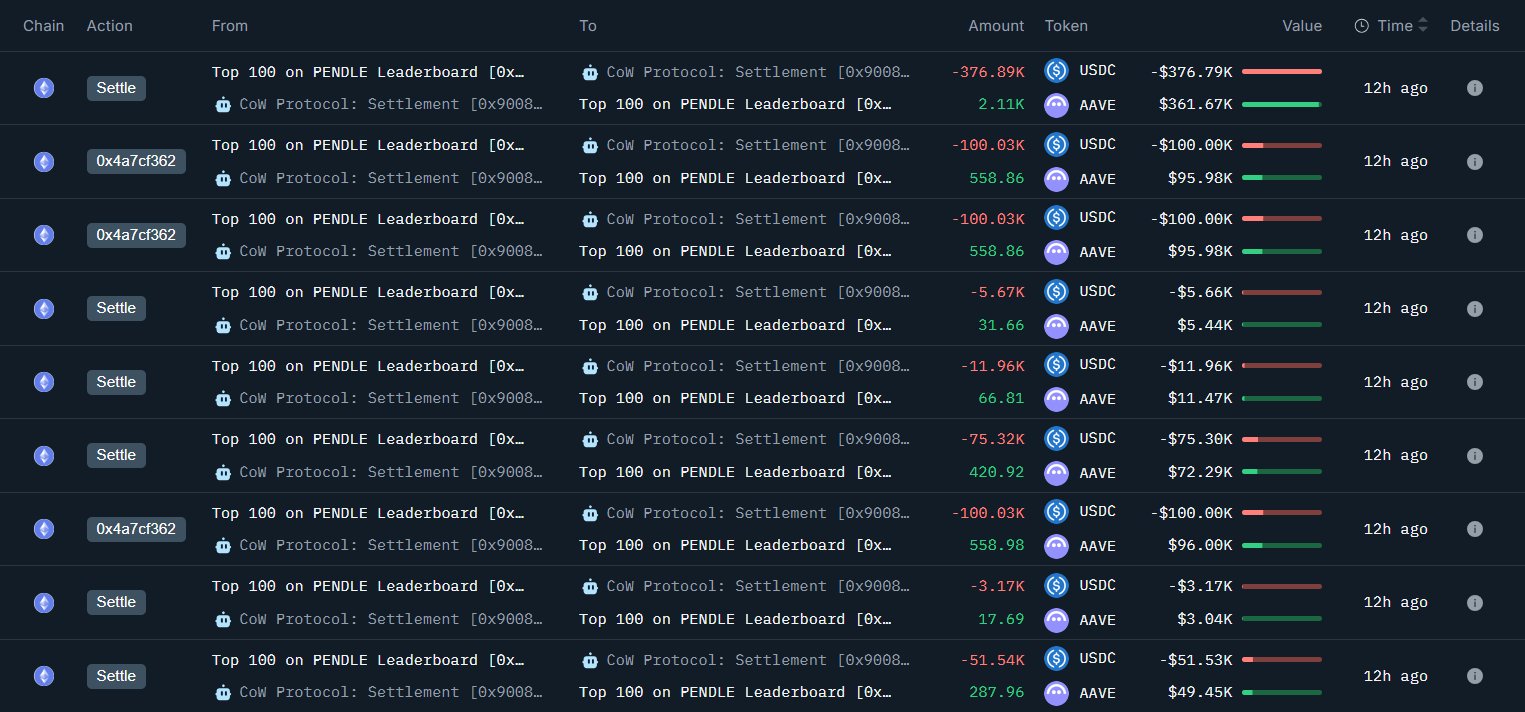
The wallet, identified as 0x6a4d361b7d0dadf8146dcfe6258a8699ea35eb81, executed multiple buys within minutes.
Each entry showed USDC leaving the address and AAVE entering, with amounts ranging from small test-size swaps to nearly $100,000 at a time.
The sequence indicates the whale accumulated the entire position through several structured trades rather than a single purchase.
At the same time, on-chain data shows the wallet still holds about $5.79 million in USDC, leaving room for additional purchases if the accumulation continues.
The pattern matches other high-volume buyers that split large orders to reduce price impact and settle through CoW Protocol to avoid MEV exposure.
The AAVE inflows totaled 16,991 tokens, which align with the $3 million outflow recorded across the transactions. The activity took place roughly 12 hours ago, based on timestamps logged in the settlement history.
AAVE Tests Long-Term Trendline as Traders Watch for a Bounce
AAVE is trading near a long-term ascending trendline after sliding from the recent local top near $399.
The 1-second chart shared by analyst Borg shows the token touching the rising support level around $178, where price has reacted multiple times over the past months.
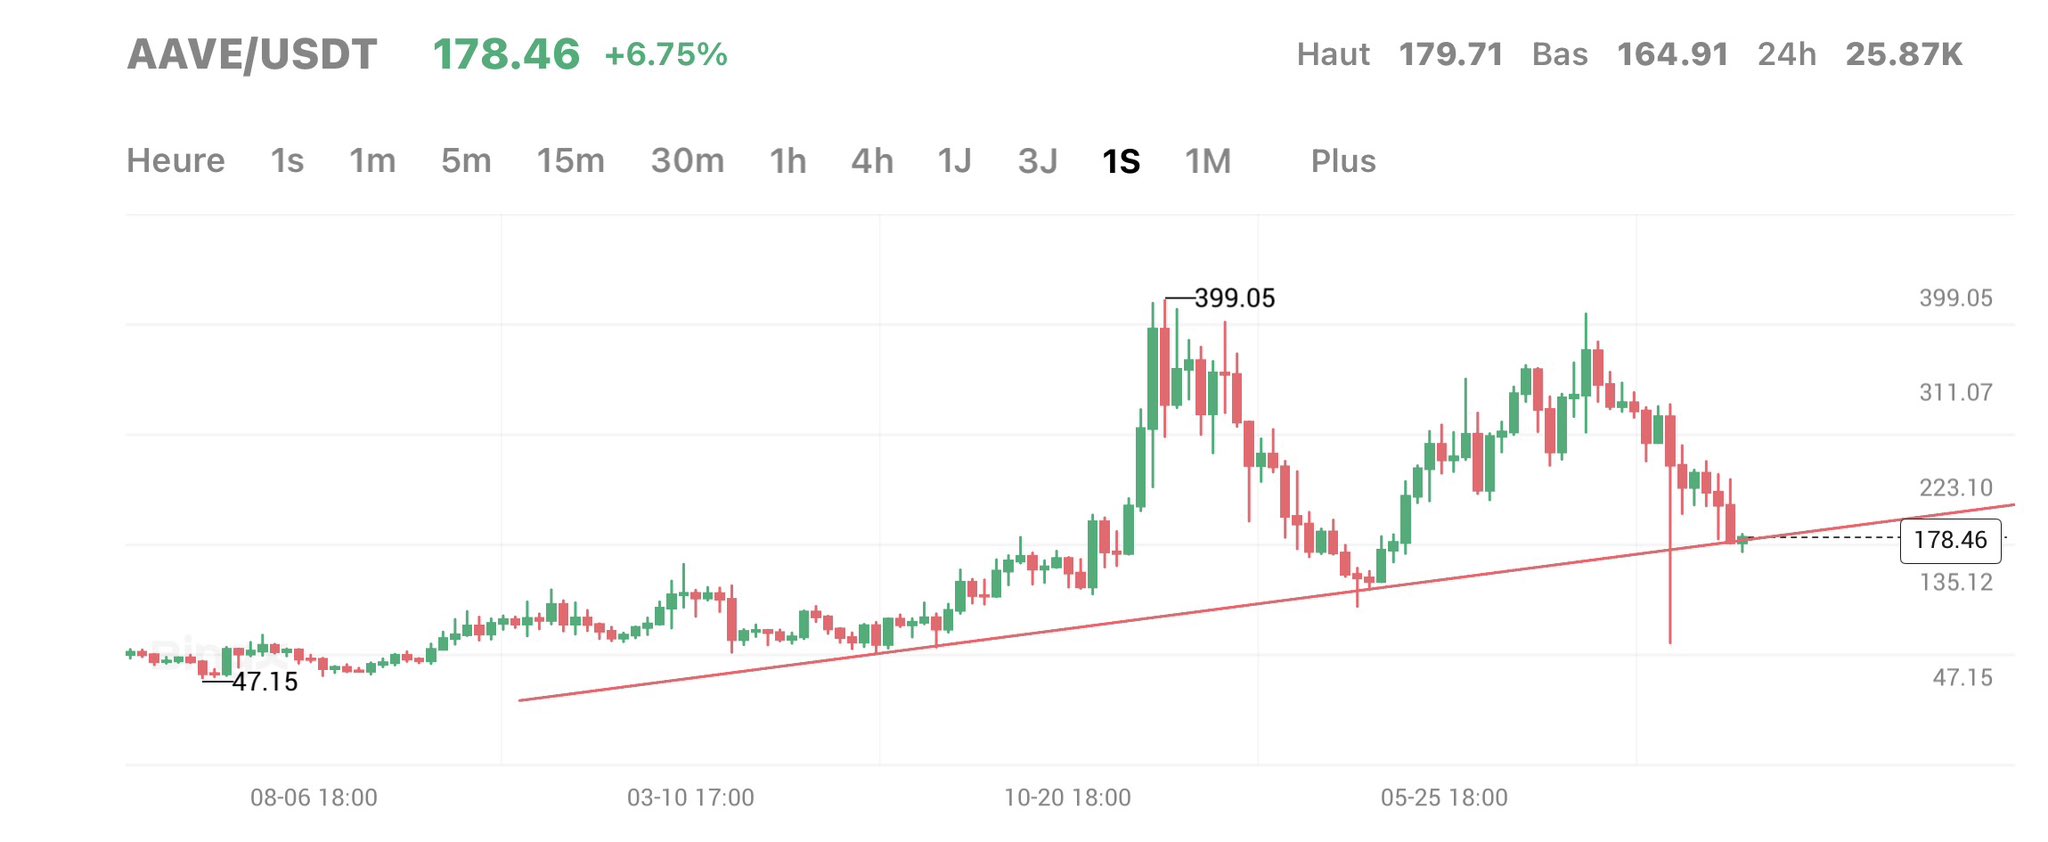
The trendline began forming after the $47 low and has guided each major recovery phase.
As price approached it again, selling pressure slowed, and AAVE stabilized near the support.
The latest candle shows buyers attempting to defend the level, which has acted as a key structure throughout the chart.
At the same time, the asset’s volatility widened as the pullback accelerated from the $311 and $223 zones. Each leg lower returned to the same diagonal support, reinforcing its importance.
The most recent touch came after a sharp downward wick, indicating that liquidity concentrated around the line before price returned above it.
Borg said he is “playing the bounce,” pointing to the technical reaction on the trendline.
The setup mirrors earlier moves where AAVE briefly dipped into the support band and recovered in the following sessions.
While the chart does not confirm the next direction, the interaction with the long-term trendline marks a notable point for short-term positioning.
Disclosure:This article does not contain investment advice or recommendations. Every investment and trading move involves risk, and readers should conduct their own research when making a decision.
Kriptoworld.com accepts no liability for any errors in the articles or for any financial loss resulting from incorrect information.

Tatevik Avetisyan is an editor at Kriptoworld who covers emerging crypto trends, blockchain innovation, and altcoin developments. She is passionate about breaking down complex stories for a global audience and making digital finance more accessible.
📅 Published: November 19, 2025 • 🕓 Last updated: November 19, 2025
