


Bitcoin dropped sharply to the 83,700 dollar zone in a single day, extending November’s steep selloff.
The daily candle shows a clear continuation of the downtrend as sellers push price further below the 50-day EMA.
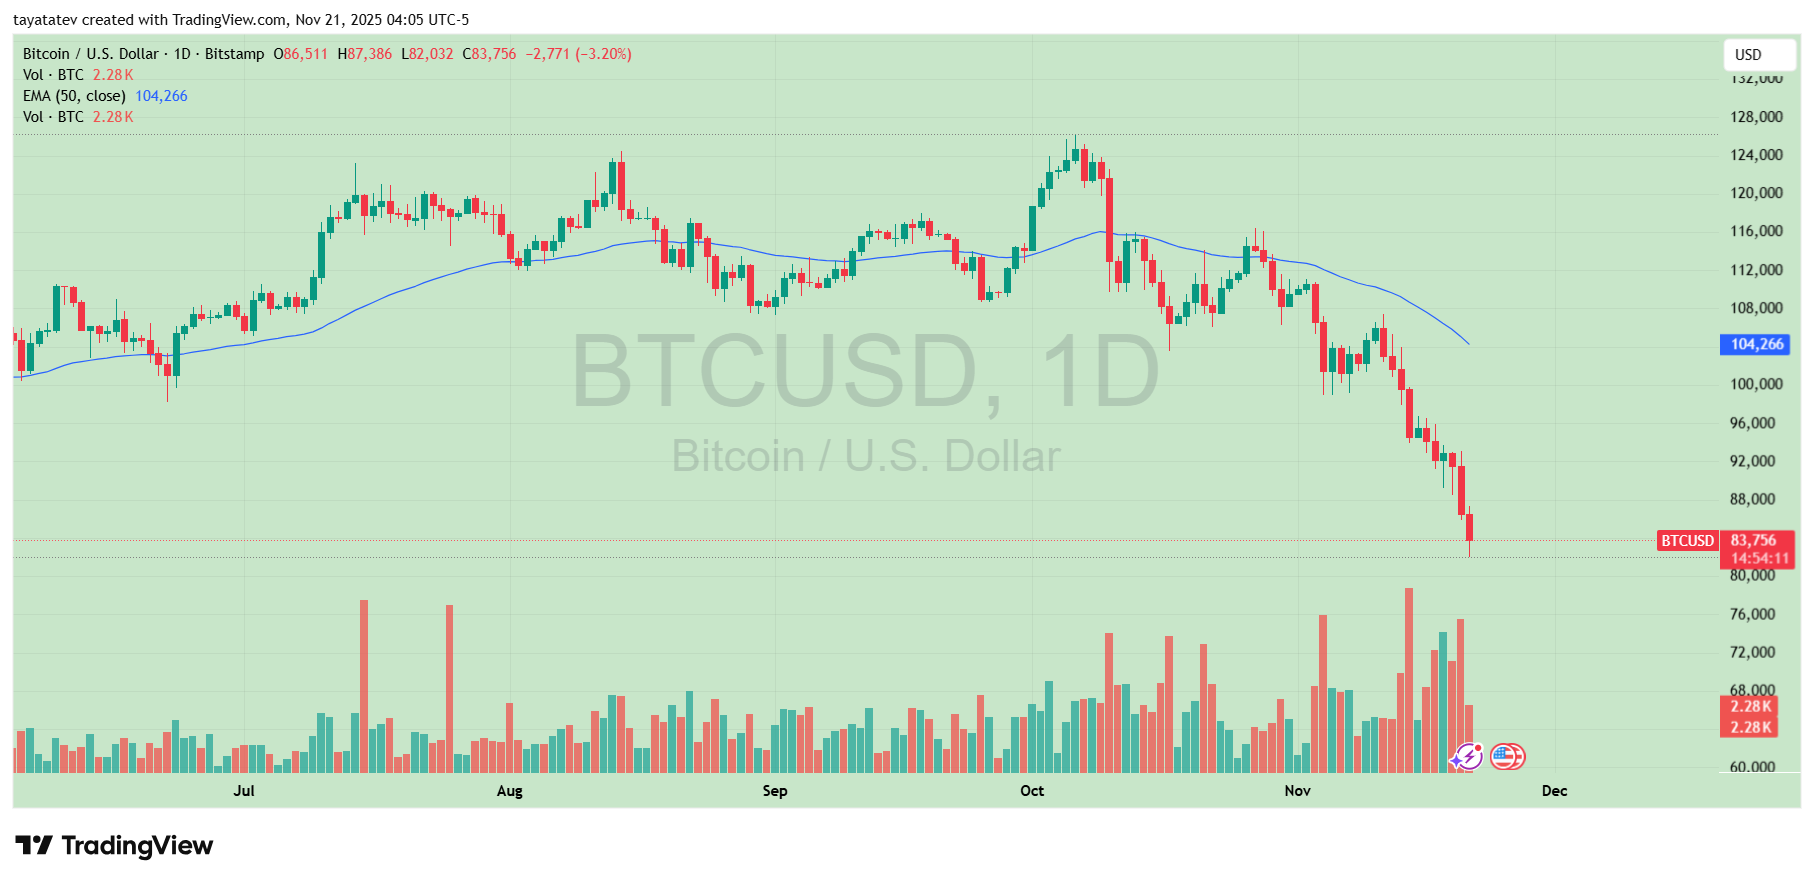
Trading volume increased during the decline, signaling stronger participation while Bitcoin moved away from the 104,000 dollar moving average.
At the same time, the chart shows no meaningful intraday bounce, indicating that bearish pressure stayed dominant throughout the session.
Moreover, the latest close places Bitcoin at its weakest level since early summer, and the trend now points to the next support area near the 80,000 dollar range.
Analyst Flags ‘Structural’ Selling Behind Bitcoin Drop
Bitcoin RSI Sinks to Lowest Level Since Q3 2025 Amid Heavy Selling
Bitcoin’s daily relative strength index has fallen to its weakest level since the third quarter of 2025, highlighting intense selling pressure on the market.
The move comes as BTC trades near the mid-80,000 dollar area after weeks of steady declines.
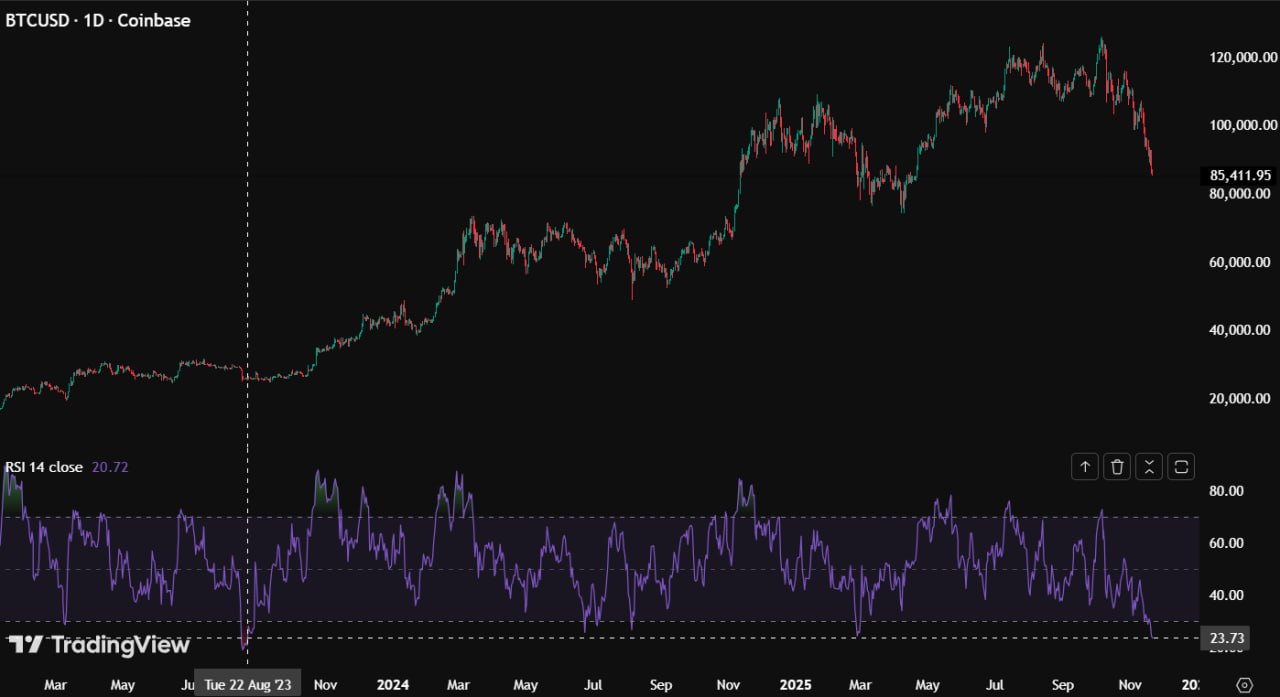
On a new BTC/USD chart, trader Cas Abbé showed the 1-day RSI sliding into deep oversold territory, hovering in the low-20s.
That level has not appeared on the indicator since mid-2025, when Bitcoin last faced a similar washout phase.
Abbé wrote on X that “the amount of selling happening right now is just too much,” pointing to the speed and size of the recent downturn.
The chart displays a sharp rollover from the prior highs with momentum weakening for several weeks before the RSI finally broke lower.
During past episodes of panic selling, Bitcoin has often seen at least a short-term bounce once RSI readings reached such depressed levels.
However, Abbé noted that this time “the selling looks very structural,” suggesting that larger or more persistent sellers may be driving the move rather than only emotional capitulation.
The combination of a historically low RSI reading and language around structural pressure places Bitcoin at a technically important point.
Market participants now watch whether oversold conditions trigger a relief rebound or whether continued systematic selling keeps the downtrend in place.
Liquidation Heatmap Shows Heavy BTC Wipeouts as Price Slides
Meanwhile, new data from CoinGlass shows intense liquidation activity across Binance’s BTC/USDT market during the past 24 hours.
The heatmap highlights a wide band of liquidations stacked between the 87,000 and 90,000 dollar region, where bright clusters indicate large concentrations of forced closes.
As Bitcoin broke below those levels, the burst of red candles aligned with the densest liquidation zones on the chart.
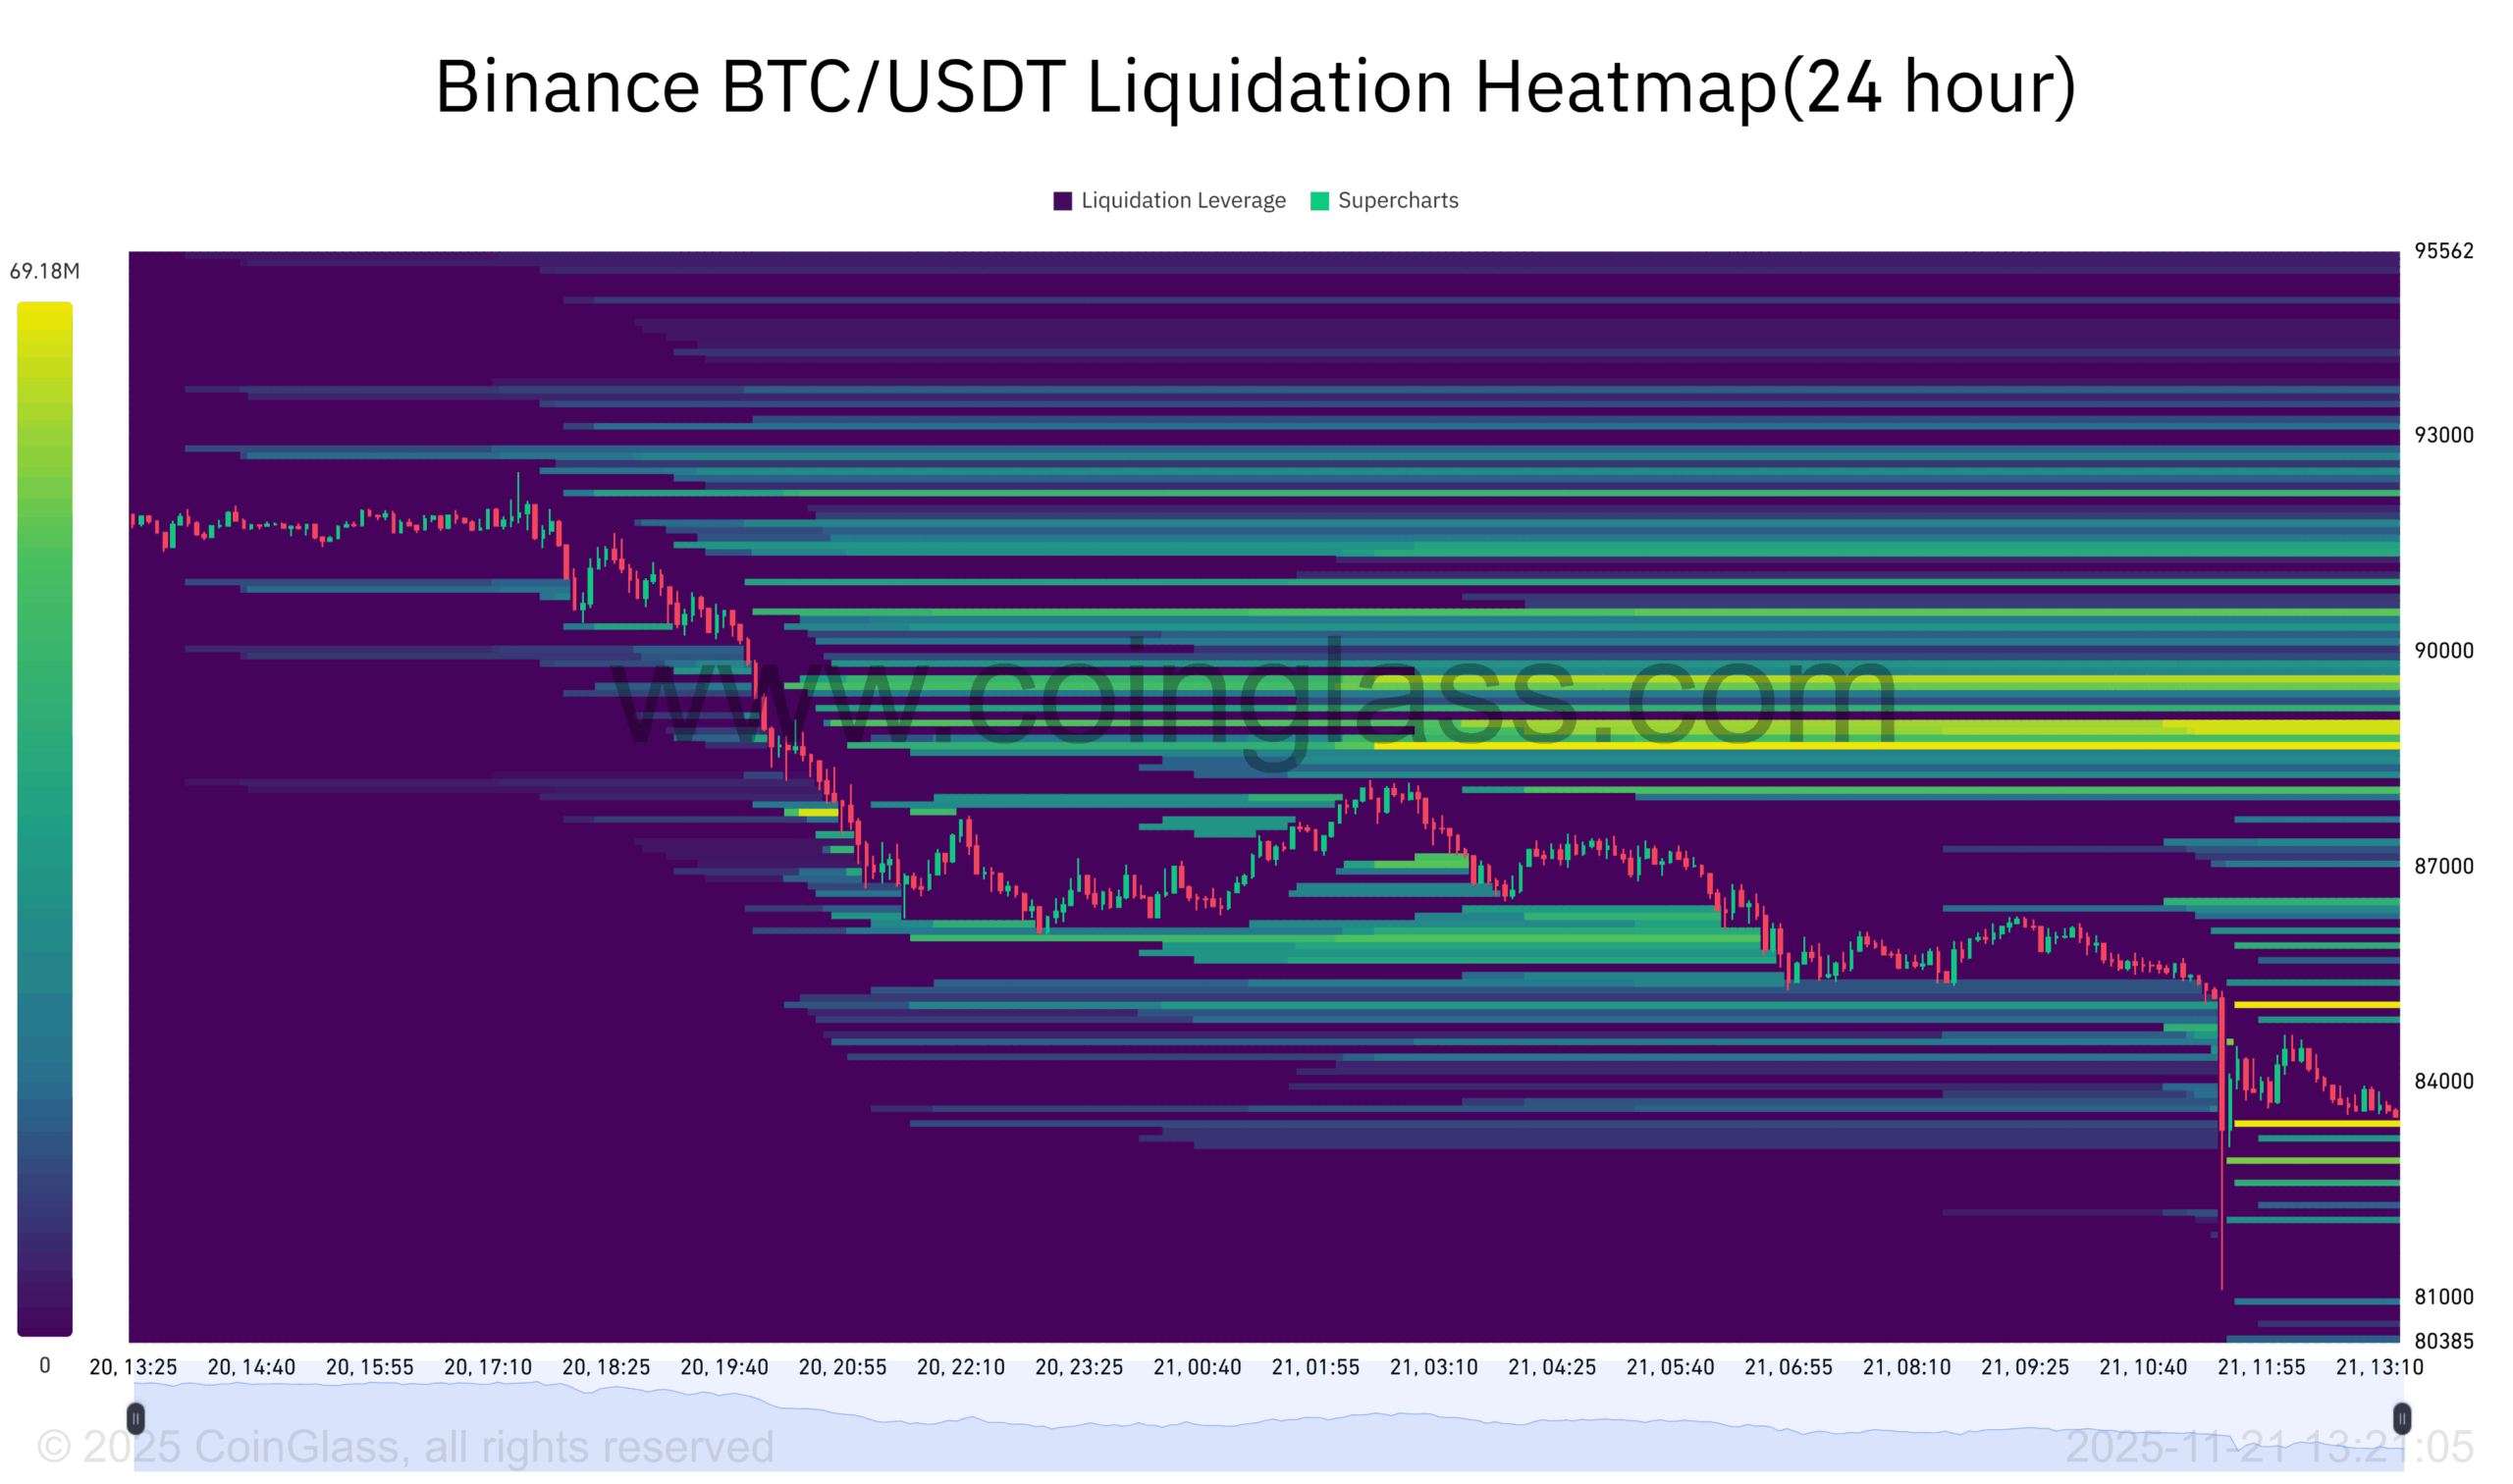
The price then continued to fall into the low-84,000 dollar area, and the heatmap reveals a second layer of liquidations triggering below 83,500 dollars.
These lower bands show thinner but steady liquidation levels, suggesting that traders used higher leverage during the initial decline and slightly smaller positions deeper in the move.
At the same time, the heatmap shows a clear structural shift in market pressure.
The top bands remain thick even after the breakdown, indicating that a large group of long positions clustered above market price.
As Bitcoin moved away from those liquidation levels, it reinforced the idea that leverage unwinding, rather than spot selling alone, intensified the drop.
Bitcoin now trades below the liquidation wall that previously supported price.
Market participants watch whether this reduced leverage zone stabilizes the market or whether new liquidation clusters form as volatility remains elevated.
Disclosure:This article does not contain investment advice or recommendations. Every investment and trading move involves risk, and readers should conduct their own research when making a decision.
Kriptoworld.com accepts no liability for any errors in the articles or for any financial loss resulting from incorrect information.

Tatevik Avetisyan is an editor at Kriptoworld who covers emerging crypto trends, blockchain innovation, and altcoin developments. She is passionate about breaking down complex stories for a global audience and making digital finance more accessible.
📅 Published: November 21, 2025 • 🕓 Last updated: November 21, 2025
