


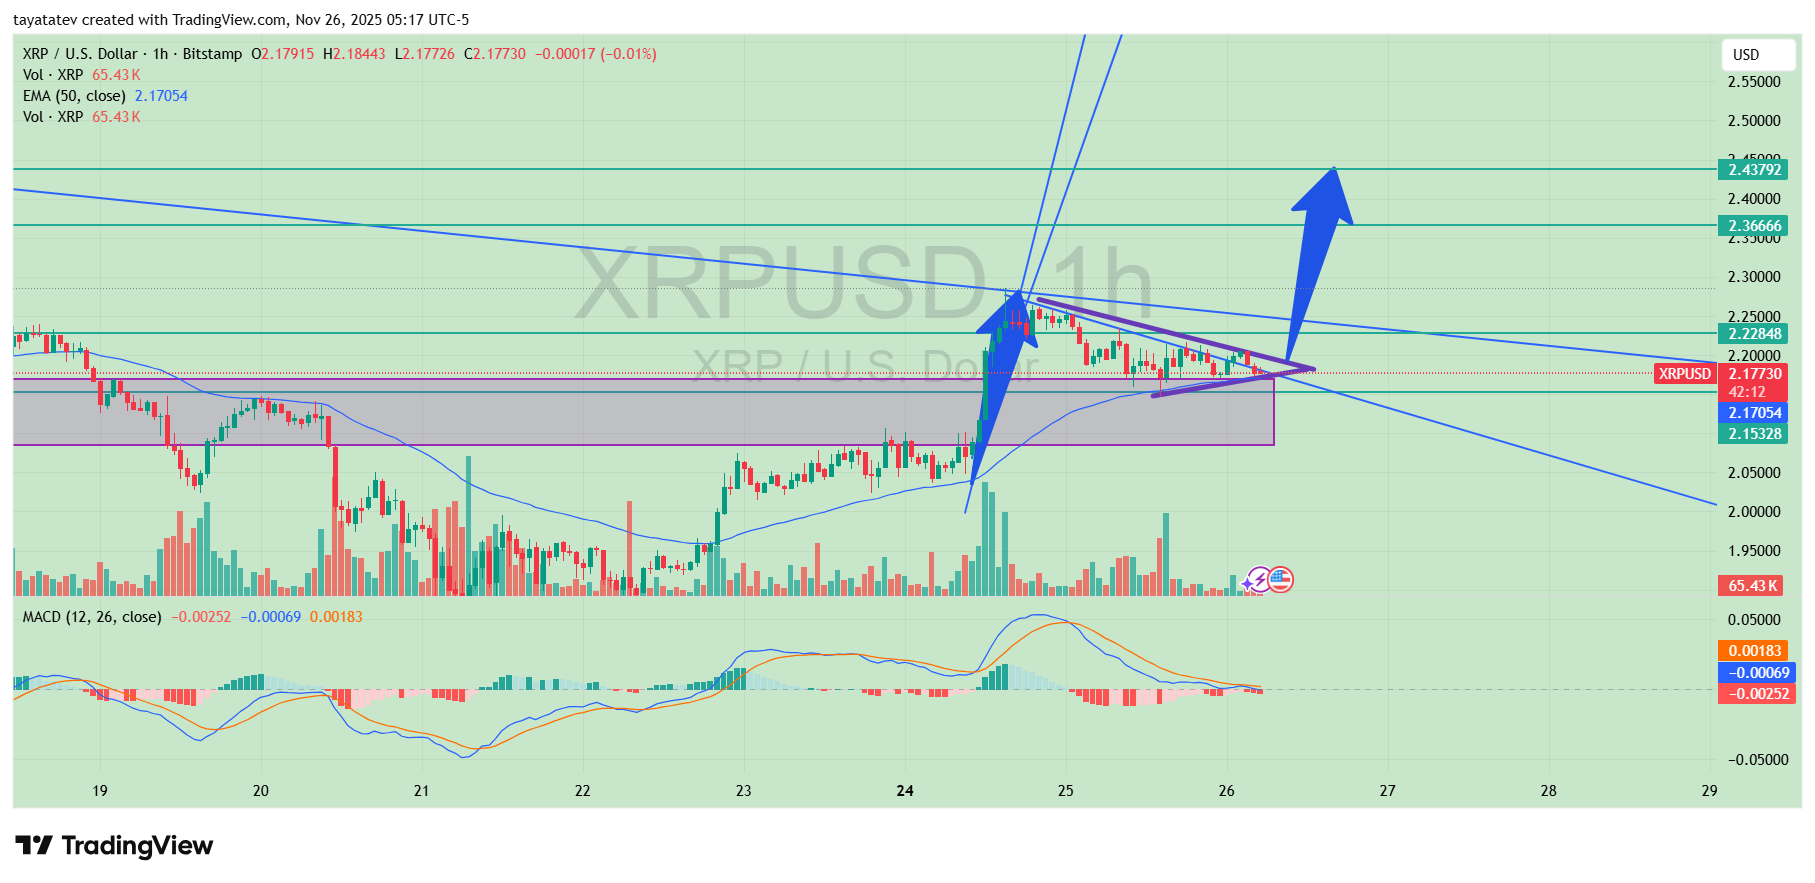
The 1-hour chart on Bitstamp shows XRP compressing into a bullish triangle. This is also called an ascending or bullish pennant triangle when price forms higher lows and flat highs. A bullish triangle is a continuation pattern.
It appears when buying pressure gradually increases. Sellers defend one top price level. Meanwhile, buyers push the lows up.
As a result, the trend lines converge. The shape looks like a coil. The coil signals a pause, not a reversal.
A bullish triangle pattern means the asset keeps its prior direction after a breakout. The pattern has three core traits.
First, price prints a series of higher lows. Second, highs stay near one resistance band. Third, volume often drops during the squeeze.
This contraction reflects both sides stepping back before a volatility surge. After the breakout, price typically expands by the width of the triangle’s base.
The violet trend lines on the chart mark the current support structure. They act as the lower boundary that bulls must hold.
As long as 1-hour candles close above those lines, the uptrend bias stays intact. If price closes below the violet support, it signals a trend change.
That would invalidate the triangle. In other words, it flips structure from higher lows to lower highs. This would mean bears regained control. The trend would likely rotate down.
At the current price of 2.17 USD, the triangle breakout projection can be measured by the base height of the structure.
The measured move from a clean breakout targets at least 11% above 2.17 USD. An 11% rise from 2.17 USD adds 0.24 USD, bringing the target near 2.41 USD.
On this specific chart, the next plotted horizontal zone aligns at 2.43 USD. Therefore, the bullish objective for this structure sits around 2.43 USD.
That level also matches the arrow drawn for expansion. It reflects a reasonable breakout destination given the pattern scale.
Because the market is squeezing tightly, direction clarity matters. Therefore, the violet lines must hold. Otherwise, the trend shifts.
For now, price respects the triangle logic. Transitioning into the breakout candle, XRP already pierced the top side near 2.22–2.23 USD.
But it needs continued closes above the triangle apex to confirm full expansion. Until that happens, the breakout is forming, not finished.
Meanwhile, the 50-period EMA printed at 2.17054 USD has flipped into micro support as well. The slope now supports the triangle narrative.
When a triangle forms above a rising EMA, strength tends to persist. However, EMA alone is secondary here. Structure support remains the violet trend line cluster.
In summary, XRP is coiling into a bullish triangle with buyers lifting lows. For the trend to continue upward, candles must stay above violet support.
Finally, a standard measured move projects 11% higher, aligning near 2.43 USD. If price falls and closes below support, the chart signals a trend rotation instead of continuation.
XRP Ledger Data Shows Big Whales Driving Spot Orders Near $2
A new chart from CryptoQuant, shared by analyst Steph Is Crypto, shows that large players now dominate spot trading on the XRP Ledger as price hovers near the $2 area.
The graphic tracks spot average order size over time and highlights how the order book has shifted from mixed participation to whale-led flow in 2025.
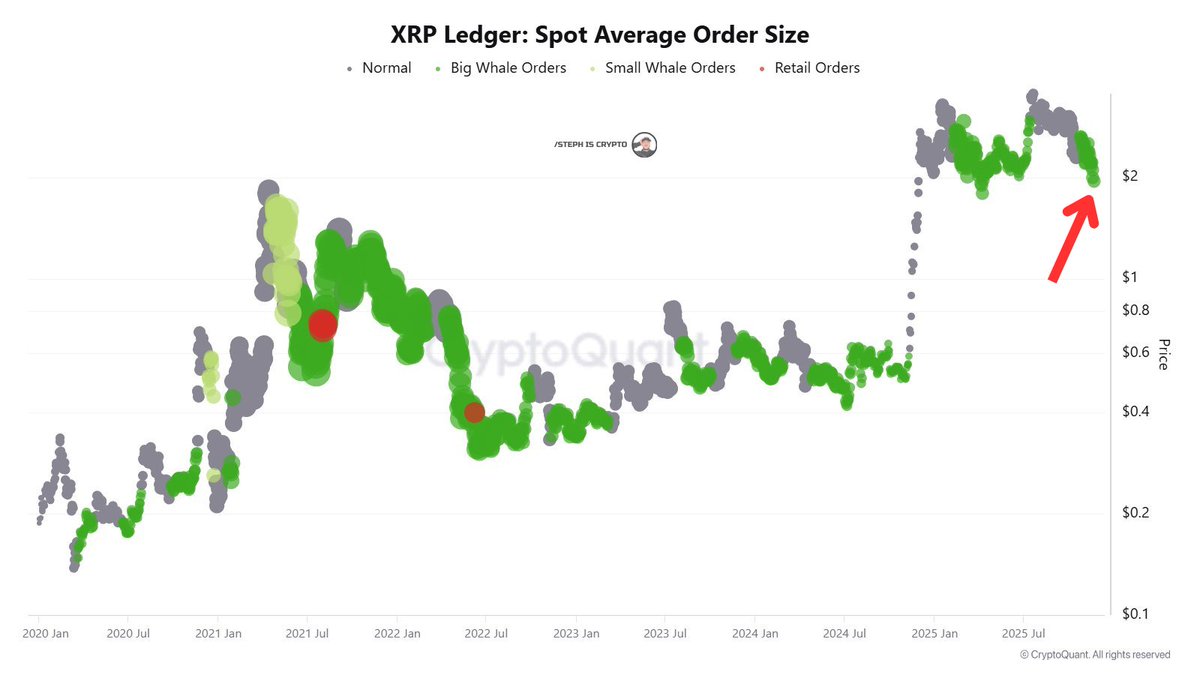
The chart plots XRP price on the right axis and overlays bubbles representing on-chain spot orders.
Grey dots mark normal orders, green bubbles show big whale orders, lighter green reflects smaller whales, and rare red dots indicate retail trades.
From 2020 through 2023, these colors appear in mixed clusters around each major price swing, suggesting that large and small participants shared control of the tape.
However, the structure changes once XRP lifts from around $0.6 to the current band near $2.
In this latest section, the chart turns heavily green, with big whale bubbles concentrated around the new range instead of fading after the rally. At the same time, retail-sized red dots remain scarce.
This combination signals that the jump toward $2 has been supported by consistently larger average spot orders on the ledger, pointing to quiet accumulation by whales rather than a short burst of short-term retail activity.
Disclosure:This article does not contain investment advice or recommendations. Every investment and trading move involves risk, and readers should conduct their own research when making a decision.
Kriptoworld.com accepts no liability for any errors in the articles or for any financial loss resulting from incorrect information.

Tatevik Avetisyan is an editor at Kriptoworld who covers emerging crypto trends, blockchain innovation, and altcoin developments. She is passionate about breaking down complex stories for a global audience and making digital finance more accessible.
📅 Published: November 26, 2025 • 🕓 Last updated: November 26, 2025
