


Cardano’s weekly ADA/USD chart shows price building a bullish flag formation after a strong upside impulse earlier in 2025.
The asset is now trading near $0.4329 while holding above a rising 50-period EMA at $0.6868, which served as dynamic support during prior uptrend phases.
Meanwhile, price action since March 2025 has moved sideways to lower, creating the sloping channel that defines the flag.
A bullish flag pattern appears after a fast upward move, called the “flagpole,” followed by a pullback or consolidation inside two parallel trendlines that slope down or sideways.
Then, the structure resembles a small pause, not trend change.
Because buying pressure often returns, the breakout usually happens upward. As a result, traders treat it as a continuation signal, meaning the prior uptrend may resume.
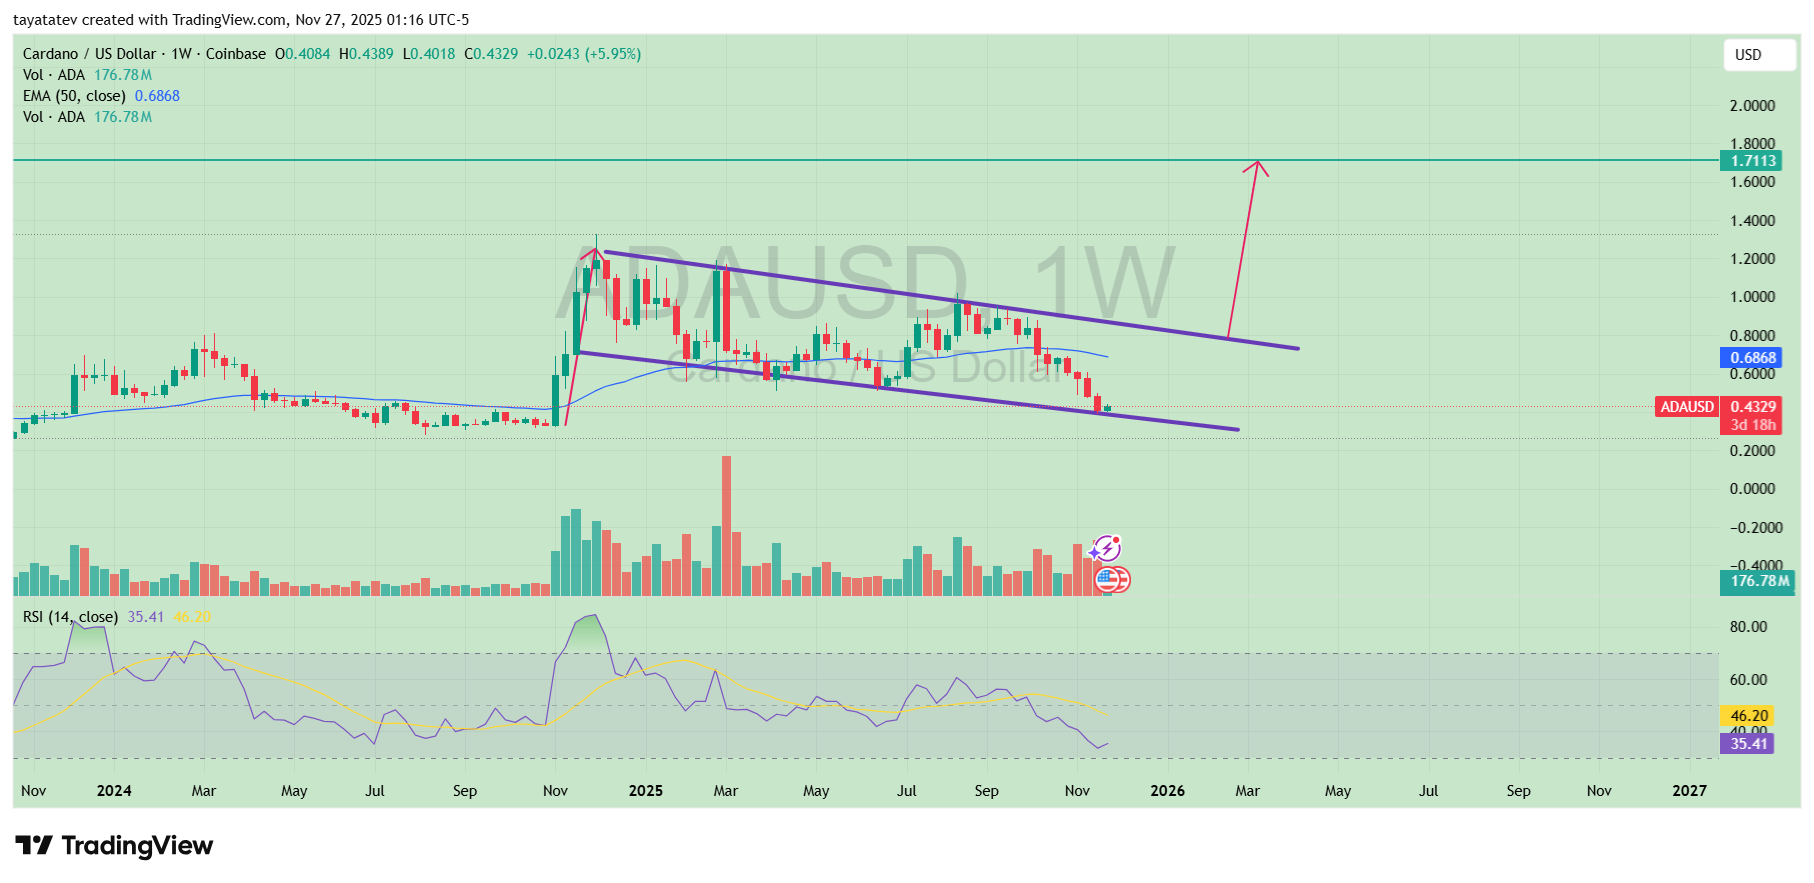
In this chart, ADA printed its flagpole near the early-2025 highs around $1.7113, and then entered a controlled consolidation range from $1.20 down toward $0.64 throughout the past months.
The parallel flag trendlines are visible, capturing lower highs and lower lows in the channel.
Price is currently near the lower boundary, which increases the importance of the coming breakout direction.
When the upper trendline breaks with higher volume and weekly candle close above it, the pattern confirms.
Then, market structure shifts again toward buyers. Because bullish flags measure targets by adding the prior flagpole’s height to the breakout point, the expected move projects from the breakout zone.
The flagpole on this chart spans roughly 269% of upward range in its initial move earlier this year.
Therefore, once confirmed, a similar proportional expansion points toward new price levels beyond resistance.
The next relevant horizontal barrier on the chart sits at $1.7113. Thus, this area becomes the confirmation retest level after breakout. If price reclaims it, momentum would point into the $1.80 to $2.00 region next.
However, the measured-move projection alone does not guarantee outcomes. It only defines the arithmetic of the structure’s prior run-up applied forward.
Market conditions also interact with the flag’s reliability. For instance, the RSI at 35.41 on the same timeframe reflects subdued momentum during consolidation.
This is normal for flags. It signals compression, not negation.
Then, lower highs on RSI and price moving in channel align with consolidation behavior, keeping the pattern intact so far.
Because ADA remains under a sloping correction channel while still respecting long-term higher-low architecture from its 2023 base, the current pattern sits at the intersection of trend pause and trend resume possibility.
Transitioning from compression to expansion depends on a breakout candle that closes above the channel’s top line, followed by a retest-hold. Then, the pattern shifts from forming to confirmed.
Bullish flags matter because they organize price into clear, testable phases. First, the market runs up.
Next, it slows. Then, it breaks out or fails. In this case, the structure is still “forming,” meaning breakout confirmation has not happened yet.
However, the shape and context meet the textbook definition for a bullish flag so far.
Cardano Holds Major Support After Long Pullback
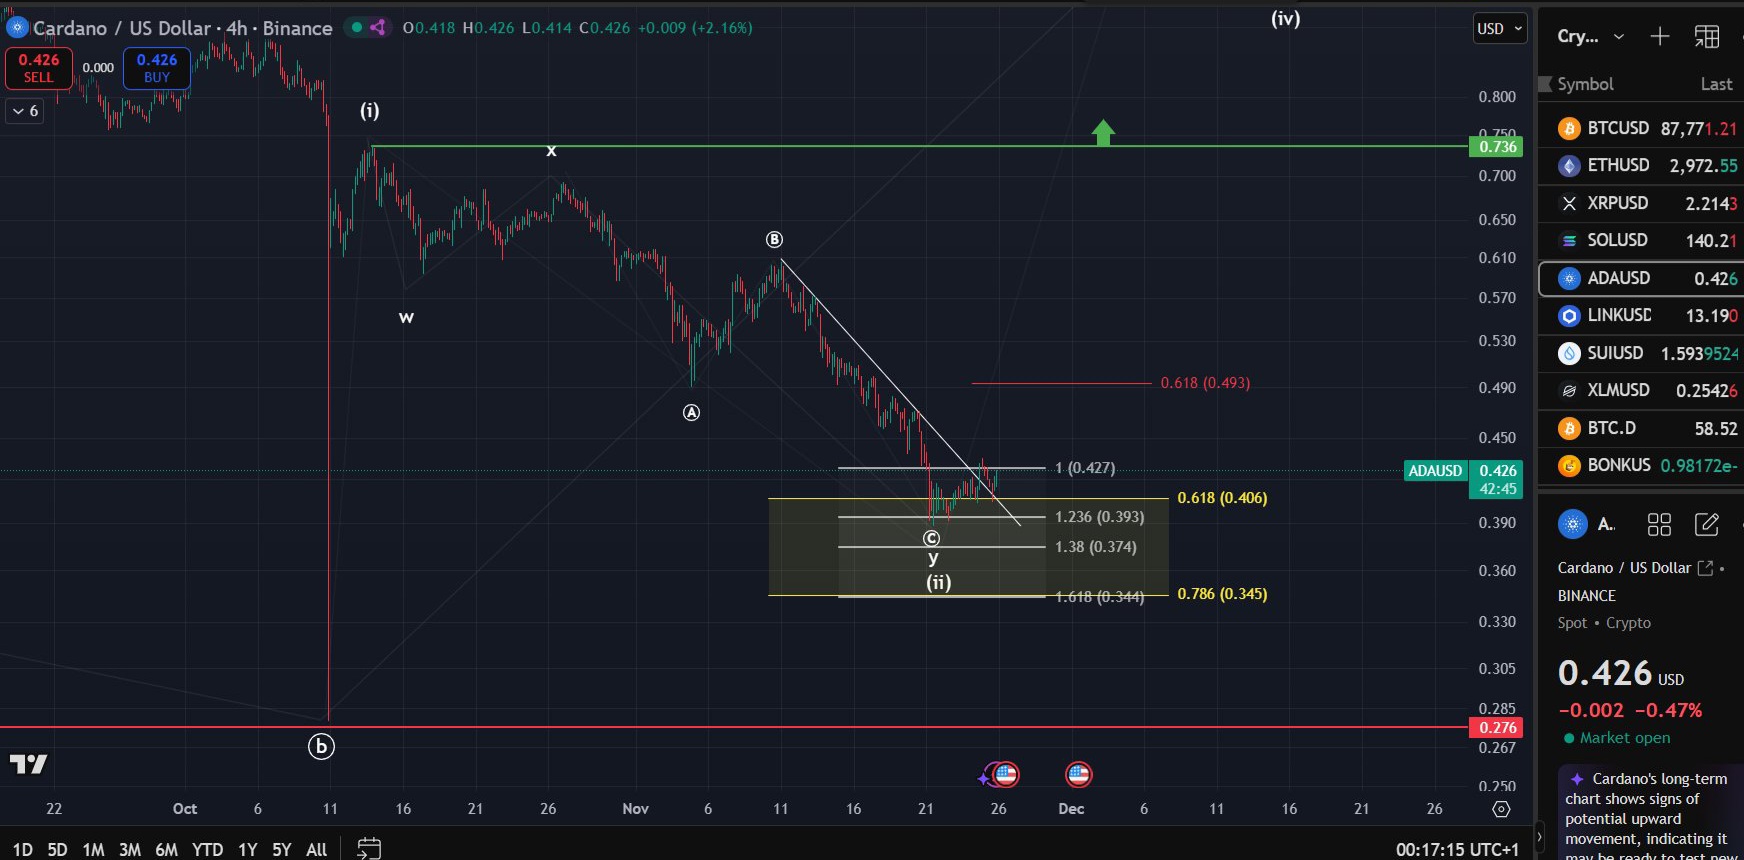
Cardano’s ADA/USD 4-hour chart on Binance shows the token trading near $0.426 while sitting inside a major support zone between roughly $0.40 and $0.35.
The area lines up with several Fibonacci extension levels from the prior decline, including the 0.618, 0.786, and 1.0 markers.
Together, these levels form a technical “demand pocket” where earlier selling pressure paused and buyers previously stepped in.
A major support zone is a price region where past trading left strong buying interest.
When price returns there, bids often slow or stop the fall because many traders see value.
In ADA’s case, the chart shows a long pullback from the early-October high toward this highlighted band, with candles now stabilizing and rejecting moves below the mid-$0.30s.
Analytics platform TapTools noted that “Cardano ADA is sitting in a major support zone after a long pullback” and said that a move higher from here would “confirm strength and set the tone for a broader recovery.”
In technical terms, a sustained bounce above short-term resistance near $0.427–$0.49 would break the local downtrend line and complete the corrective leg labeled W–X–Y on the chart.
Then, the structure would open room for the next wave up toward the previous resistance region around $0.73.
Disclosure:This article does not contain investment advice or recommendations. Every investment and trading move involves risk, and readers should conduct their own research when making a decision.
Kriptoworld.com accepts no liability for any errors in the articles or for any financial loss resulting from incorrect information.

Tatevik Avetisyan is an editor at Kriptoworld who covers emerging crypto trends, blockchain innovation, and altcoin developments. She is passionate about breaking down complex stories for a global audience and making digital finance more accessible.
📅 Published: November 27, 2025 • 🕓 Last updated: November 27, 2025
