


The weekly ADA USD chart shows a bullish flag pattern, which forms after a sharp upward move and pauses inside a downward sloping channel before a potential continuation higher.
In simple terms, price moves up strongly, then consolidates lower in an orderly way, while buyers remain in control.
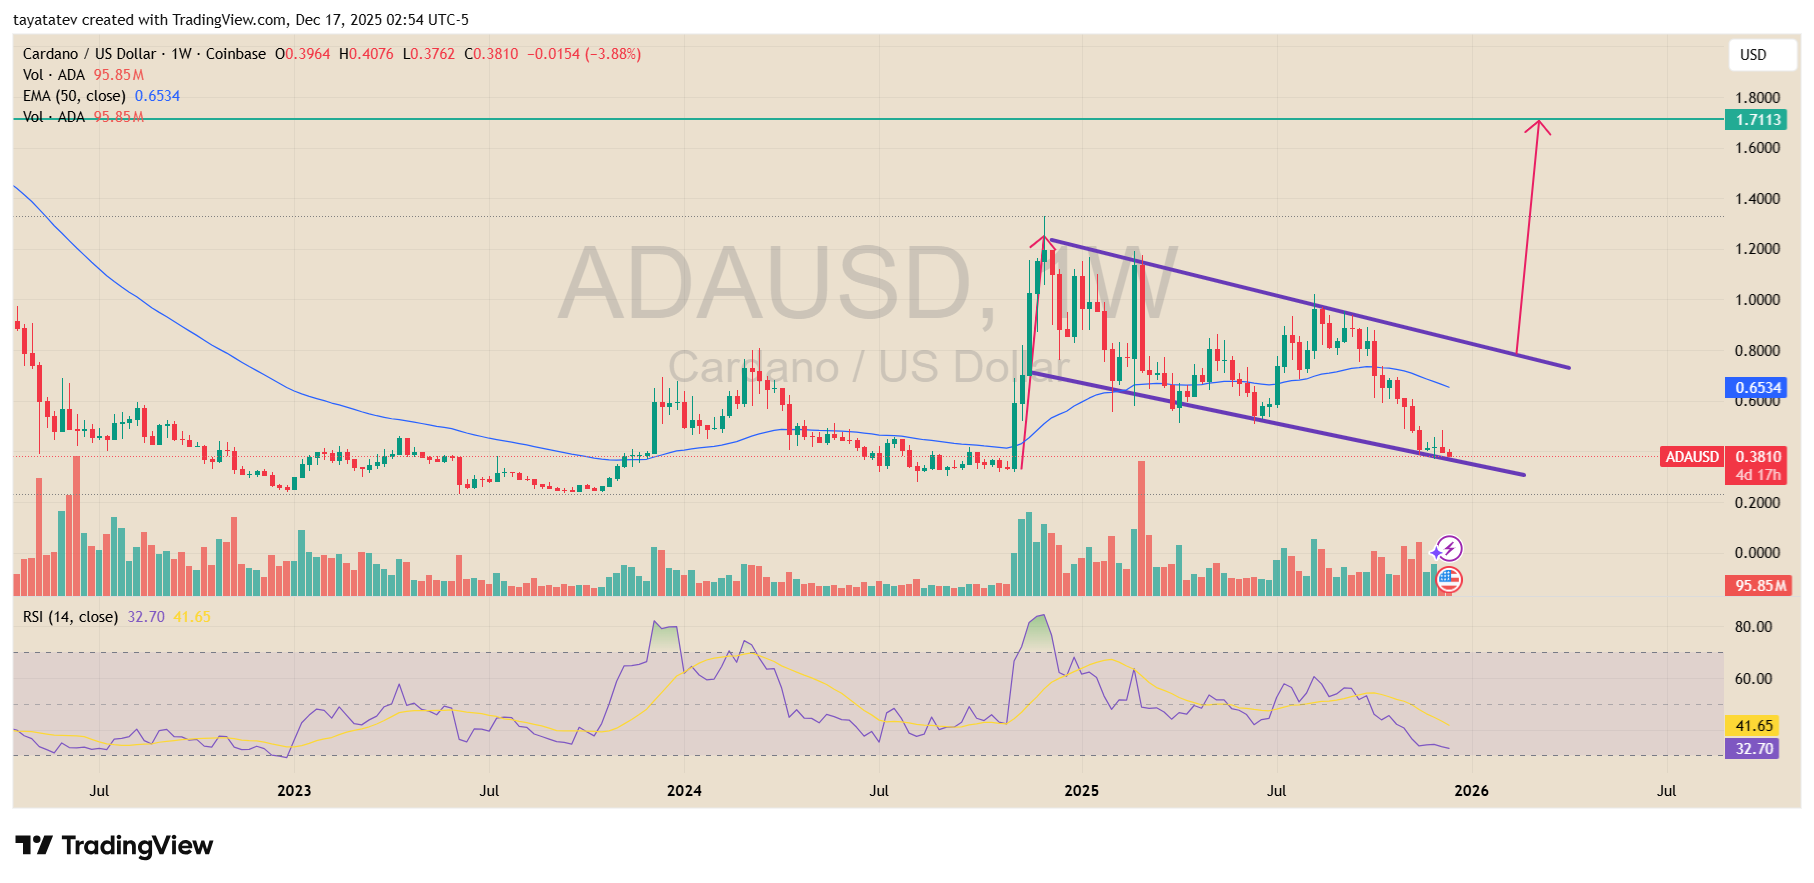
Here, Cardano surged sharply in late 2024, then entered a controlled pullback inside a descending channel. Since then, price has respected both the upper and lower boundaries of that channel, which confirms the flag structure.
Meanwhile, the broader trend remains intact because the consolidation did not erase the prior impulse move.
This behavior fits a textbook bullish flag, as selling pressure stays limited and volatility contracts instead of expanding.
At the same time, ADA trades well below the 50 week EMA near $0.65, which signals that price is still deep in the consolidation phase.
However, this also leaves room for expansion if a breakout occurs. The RSI sits near the low 30s, which shows weak momentum but also suggests selling pressure may already be stretched. Historically, bullish flags often resolve once momentum resets like this.
If ADA breaks above the upper boundary of the flag, the pattern projects a continuation move equal to the prior impulse.
Based on the measured move from the flagpole, that breakout would imply a potential upside of about 358 percent from the current price near $0.38, targeting the $1.70 to $1.75 zone.
This aligns closely with the marked resistance near $1.71, which acts as the next major upside level on the weekly chart.
Until a breakout happens, the flag remains a consolidation, not a confirmation. However, the structure itself already defines the bullish bias, as long as price stays within the channel and holds above the broader base formed earlier in the cycle.
ADA Tests Descending Channel Support on 2 Day Chart
Cardano traded near $0.3811 on the 2 day ADA USDT chart on Binance, after the session printed O $0.3963, H $0.4077, L $0.3773, C $0.3811, a 3.84% decline on the candle shown.
At the same time, price sat on the lower boundary of a descending channel, which has guided lower highs and lower lows through 2025.
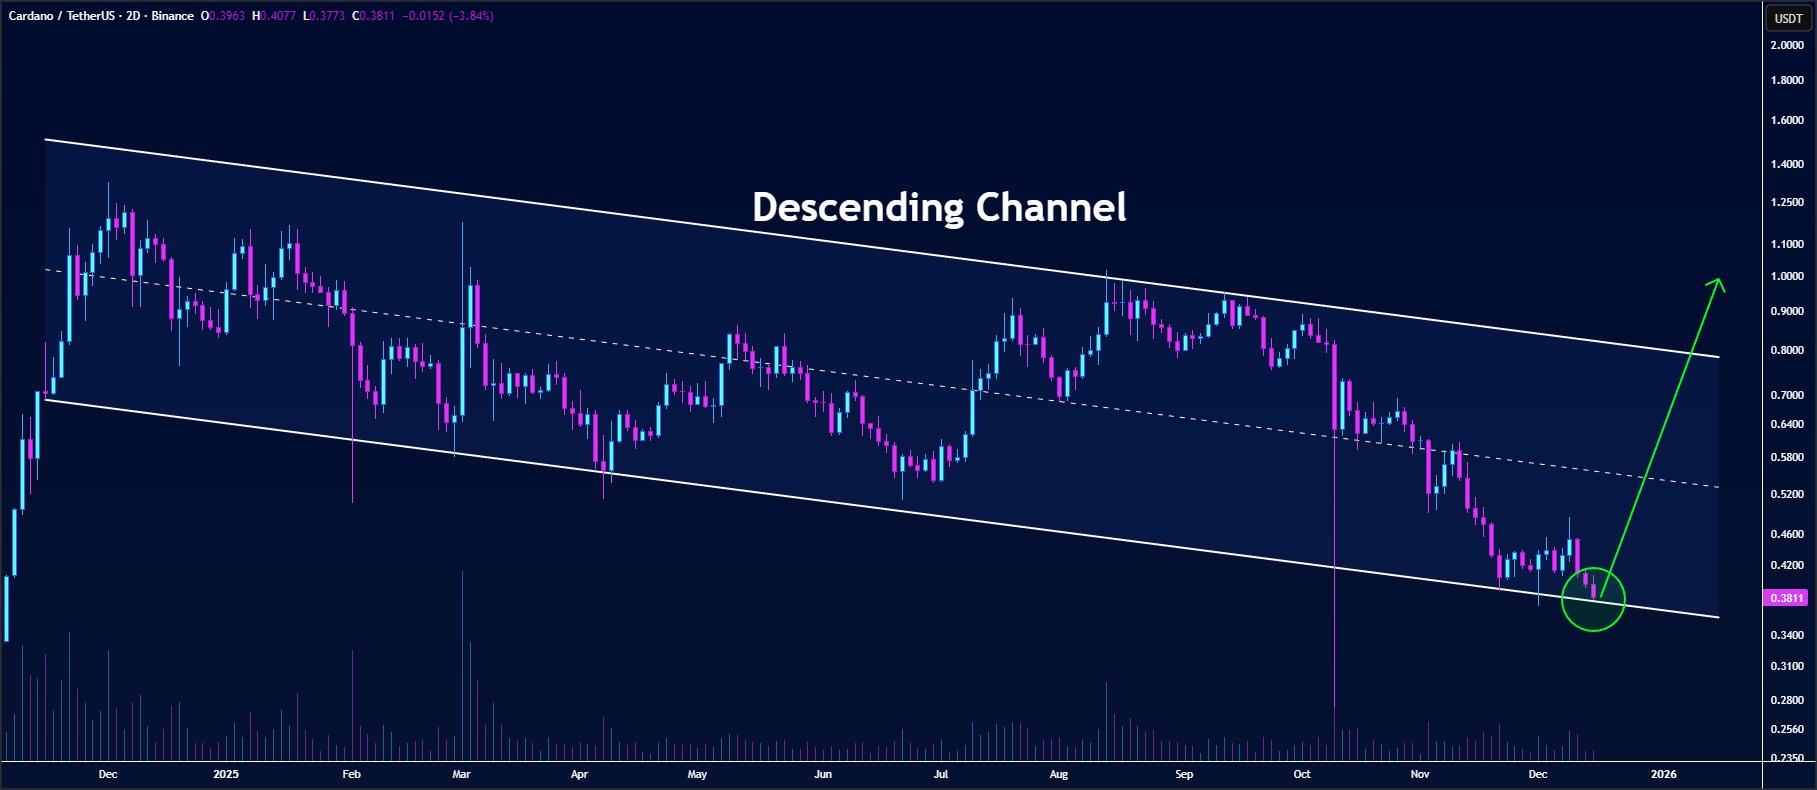
The chart marked that lower channel line as the immediate support zone, so the current area becomes a key decision point.
If buyers keep price above the channel floor, then ADA can attempt a rebound toward the channel’s midpoint first, and then the upper boundary later.
However, if sellers push price below the lower trendline, then the structure signals continuation risk, because the channel break would confirm a fresh downside leg.
The setup also shows why traders focus on this spot. Price compressed after a sharp selloff into November, then moved sideways near the channel base, which often happens before a volatility expansion.
Therefore, the next clean move usually comes from either a firm bounce off support or a clear breakdown through it.
Disclosure:This article does not contain investment advice or recommendations. Every investment and trading move involves risk, and readers should conduct their own research when making a decision.
Kriptoworld.com accepts no liability for any errors in the articles or for any financial loss resulting from incorrect information.

Tatevik Avetisyan is an editor at Kriptoworld who covers emerging crypto trends, blockchain innovation, and altcoin developments. She is passionate about breaking down complex stories for a global audience and making digital finance more accessible.
📅 Published: December 17, 2025 • 🕓 Last updated: December 17, 2025
