


Shiba Inu’s daily chart against Tether on Binance shows a clear bearish flag pattern, reinforcing the token’s broader downtrend as of Dec. 19, 2025, according to TradingView data.
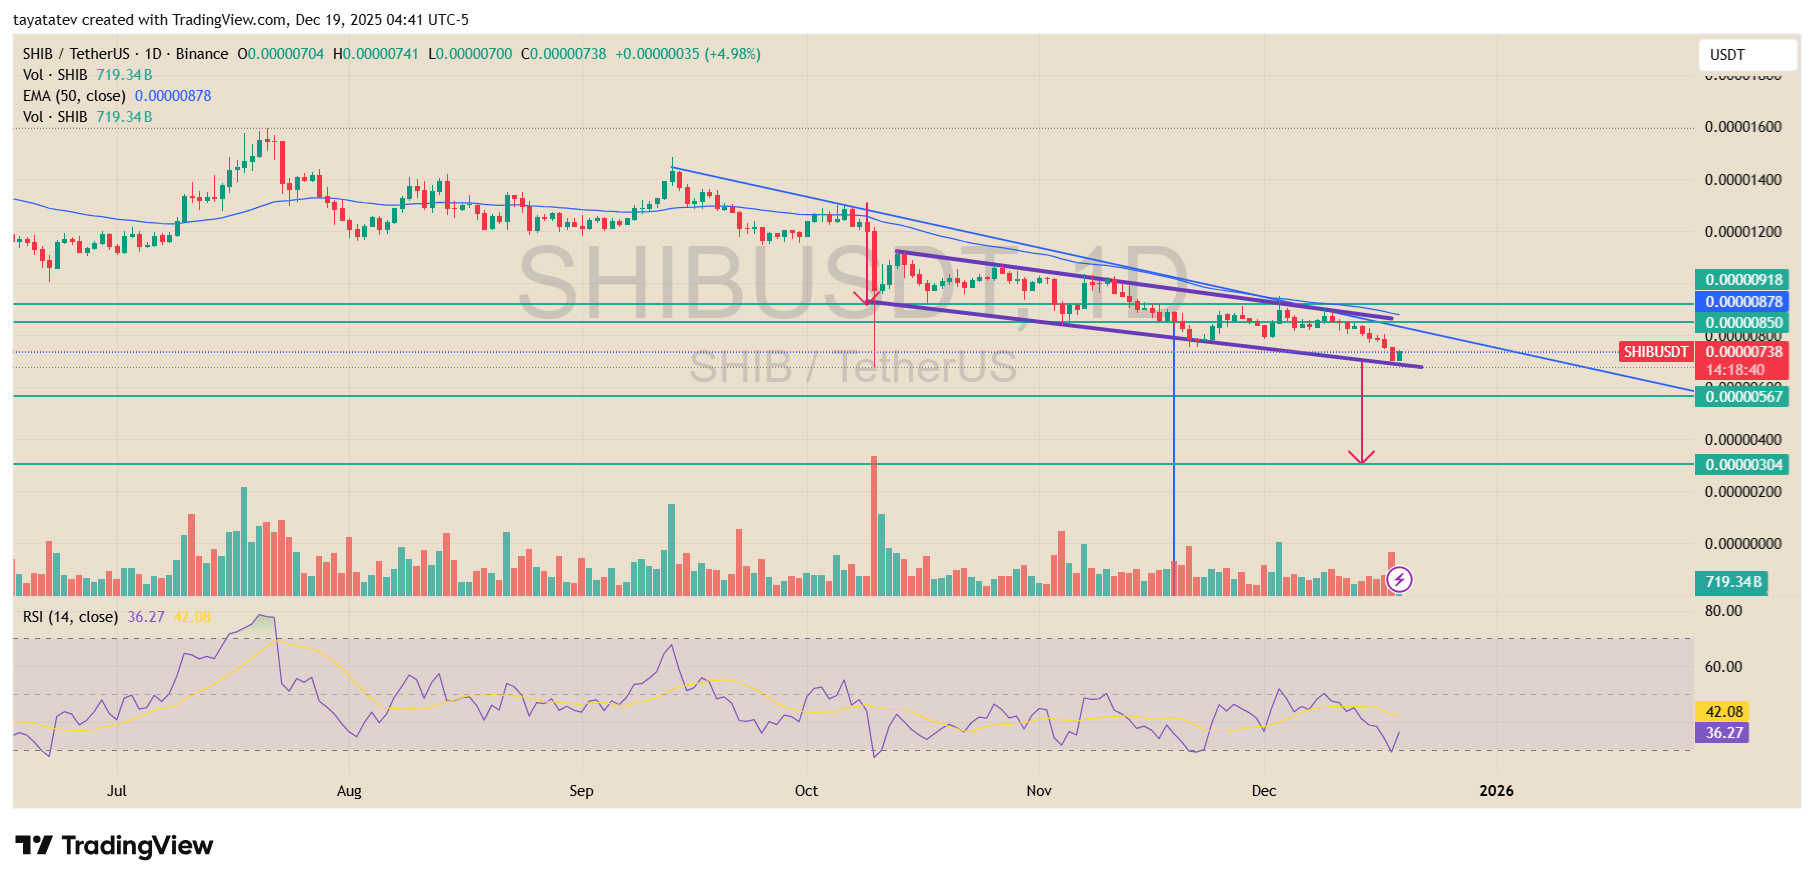
SHIB traded near 0.00000738 at the time of the chart, holding below its 50 day exponential moving average and continuing to post lower highs since October. That structure confirms sellers remain in control, while rebounds keep failing under descending trendline resistance.
A bearish flag forms when price drops sharply, then moves sideways or slightly higher inside a narrow channel before sellers attempt to resume the prior decline. On SHIB’s chart, the flag developed after a steep October selloff, followed by a tight consolidation within downward sloping boundaries.
Price remains compressed near the lower edge of that channel. At the same time, horizontal support levels have already broken and flipped into resistance. These failed reclaim attempts suggest buyers lack strength to reverse the trend.
The broader structure also shows SHIB trading inside a long-term descending trend, marked by falling resistance stretching from mid-year highs into December. As long as price stays below that trendline and the 50 day EMA, downside risk remains dominant.
The pattern has not fully confirmed yet, because confirmation typically requires a decisive daily close below the flag’s lower boundary. However, the chart already shows price pressing that level, while momentum indicators remain weak. The relative strength index sits in the mid-30s, which reflects persistent bearish pressure rather than recovery strength.
If the bearish flag breaks down and confirms, the measured move points to a potential decline of roughly 60% from the current price. That projection would place SHIB near the 0.0000030 to 0.0000035 zone, which aligns with prior historical support marked on the chart.
Until buyers reclaim key resistance levels, the technical picture keeps Shiba Inu in a confirmed downtrend with bearish continuation risk still in focus.
Shiba Inu chart maps next breakout levels as downtrend holds
Shiba Inu’s daily chart priced in U.S. dollars showed SHIB trading near 0.000007533 on Dec. 18, while price stayed in a broader decline that began in November, according to TradingView data. Meanwhile, TheCryptoBasic published a Dec. 18 thread pointing traders to the next technical levels SHIB would need to clear.
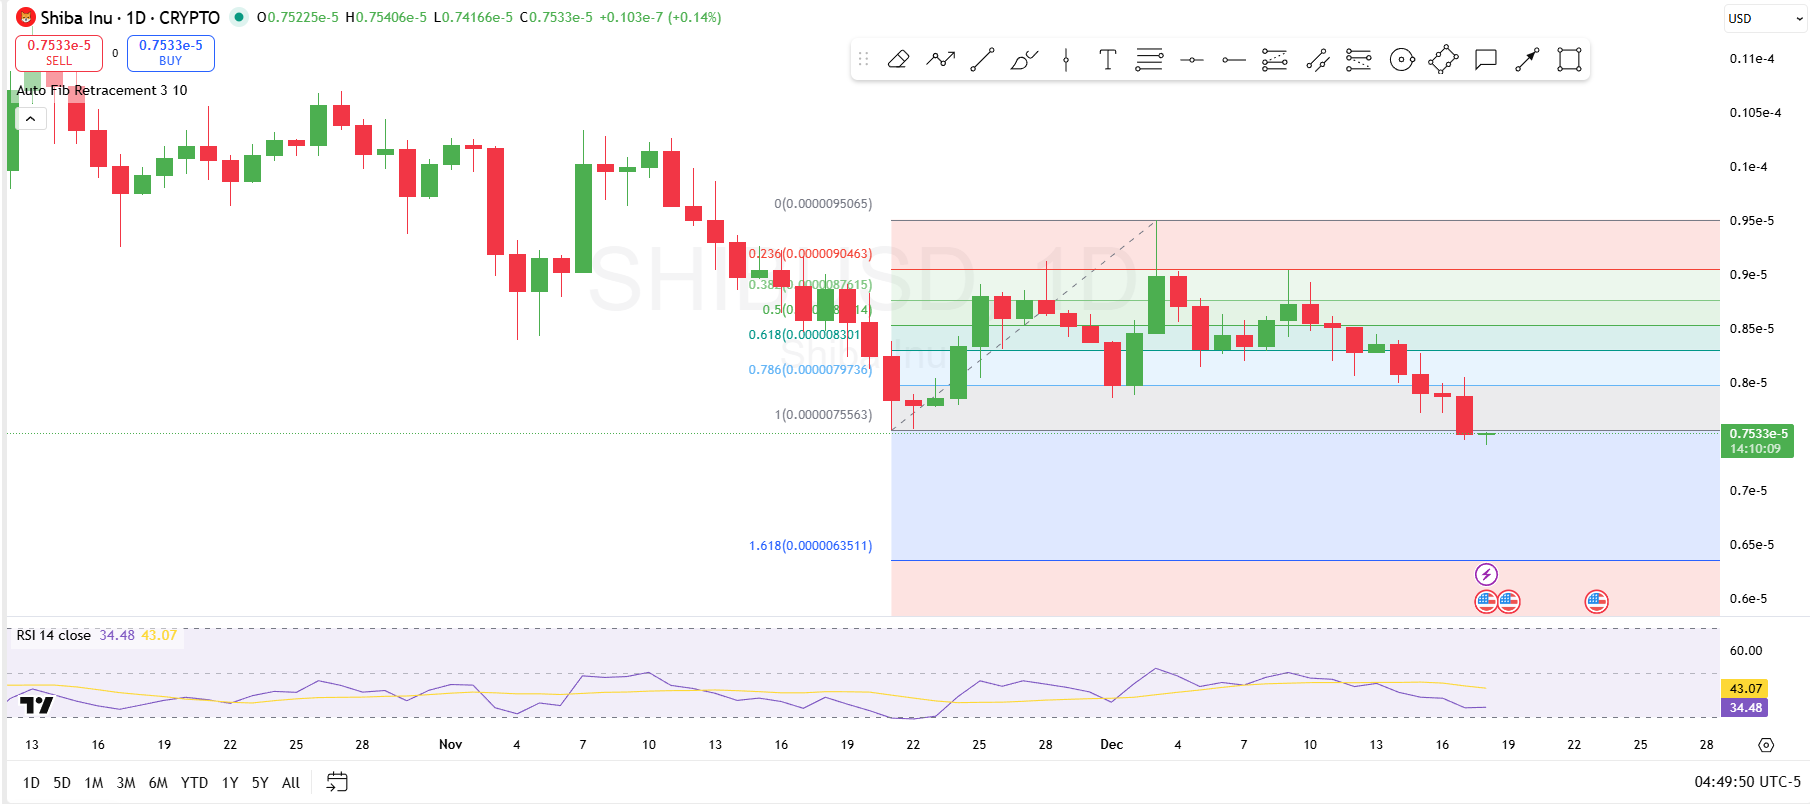
The chart’s Fibonacci retracement overlay marked several upside hurdles above the current price. First, SHIB would need to push back above the 0.786 level near 0.0000079736. After that, the next resistance bands sit around 0.000008301 at the 0.618 retracement, then 0.00000841 near the 0.5 line, followed by 0.0000087615 at the 0.382 level. Above those, the 0.236 retracement near 0.0000090463 and the swing reference near 0.0000095065 remain higher targets, but price has not reclaimed those zones.
At the same time, the downside levels remain clear if selling continues. The chart showed SHIB hovering close to the 1.0 line near 0.0000075563, which acted as a nearby support marker. Below that, the 1.618 extension near 0.0000063511 stood out as a deeper downside level.
Momentum stayed weak. The 14 period RSI printed about 34.48, which kept the indicator in a soft zone and signaled that buyers still lack strength. As long as SHIB fails to reclaim the higher Fibonacci bands, the structure keeps a bearish bias and leaves the token trading in a declining trend.
Disclosure:This article does not contain investment advice or recommendations. Every investment and trading move involves risk, and readers should conduct their own research when making a decision.
Kriptoworld.com accepts no liability for any errors in the articles or for any financial loss resulting from incorrect information.

Tatevik Avetisyan is an editor at Kriptoworld who covers emerging crypto trends, blockchain innovation, and altcoin developments. She is passionate about breaking down complex stories for a global audience and making digital finance more accessible.
📅 Published: December 19, 2025 • 🕓 Last updated: December 19, 2025
