


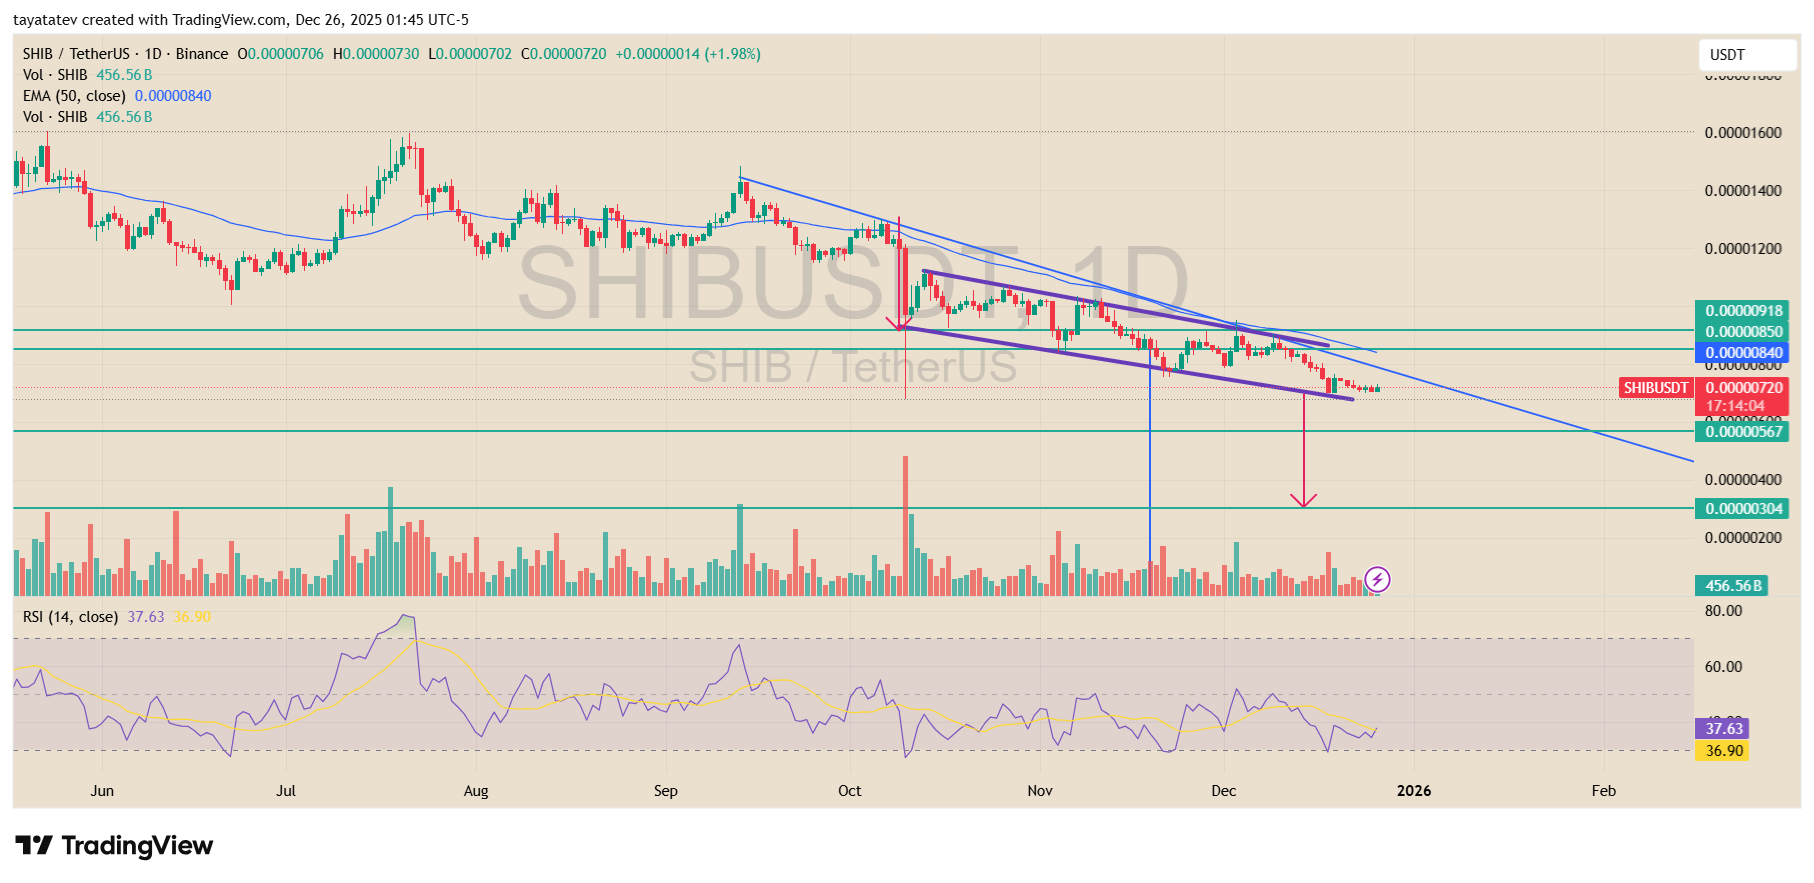
The daily SHIB USDT chart created on Dec. 26, 2025, shows price trading inside a clear descending channel that also fits the structure of a bearish flag.
Since early October, SHIB has printed lower highs and lower lows, while price stayed capped under falling resistance and compressed within two downward sloping trendlines.
Stay ahead in the crypto world – follow us on X for the latest updates, insights, and trends!🚀
This structure reflects sustained selling pressure rather than temporary consolidation.
A descending channel forms when price trends lower between parallel resistance and support lines. It shows continuation of an existing downtrend.
A bearish flag develops after a sharp sell off, followed by a tight, downward consolidation. In both patterns, price pauses but fails to attract strong demand. As a result, sellers usually retain control until a breakdown confirms continuation.
In this case, SHIB broke sharply lower in October, then moved sideways to lower inside the channel. Price remained below the 50 day exponential moving average, which acted as dynamic resistance near 0.00000840.
Each rebound stalled earlier than the last, while volume faded during consolidation.
Meanwhile, the relative strength index stayed below the neutral 50 level and hovered near the mid 30s, showing weak momentum without strong bullish divergence.
The structure confirms risk to the downside as long as SHIB trades inside the descending channel.
If price breaks below the lower boundary and confirms continuation, the measured move from the bearish flag projects a decline of about 57 percent from the current level near 0.00000720.
That move points toward the 0.00000304 area, which aligns with a prior support zone marked on the chart.
Until price reclaims the upper channel resistance and the 50 day EMA with strong volume, the broader structure remains bearish. The chart continues to reflect distribution and trend continuation rather than reversal.
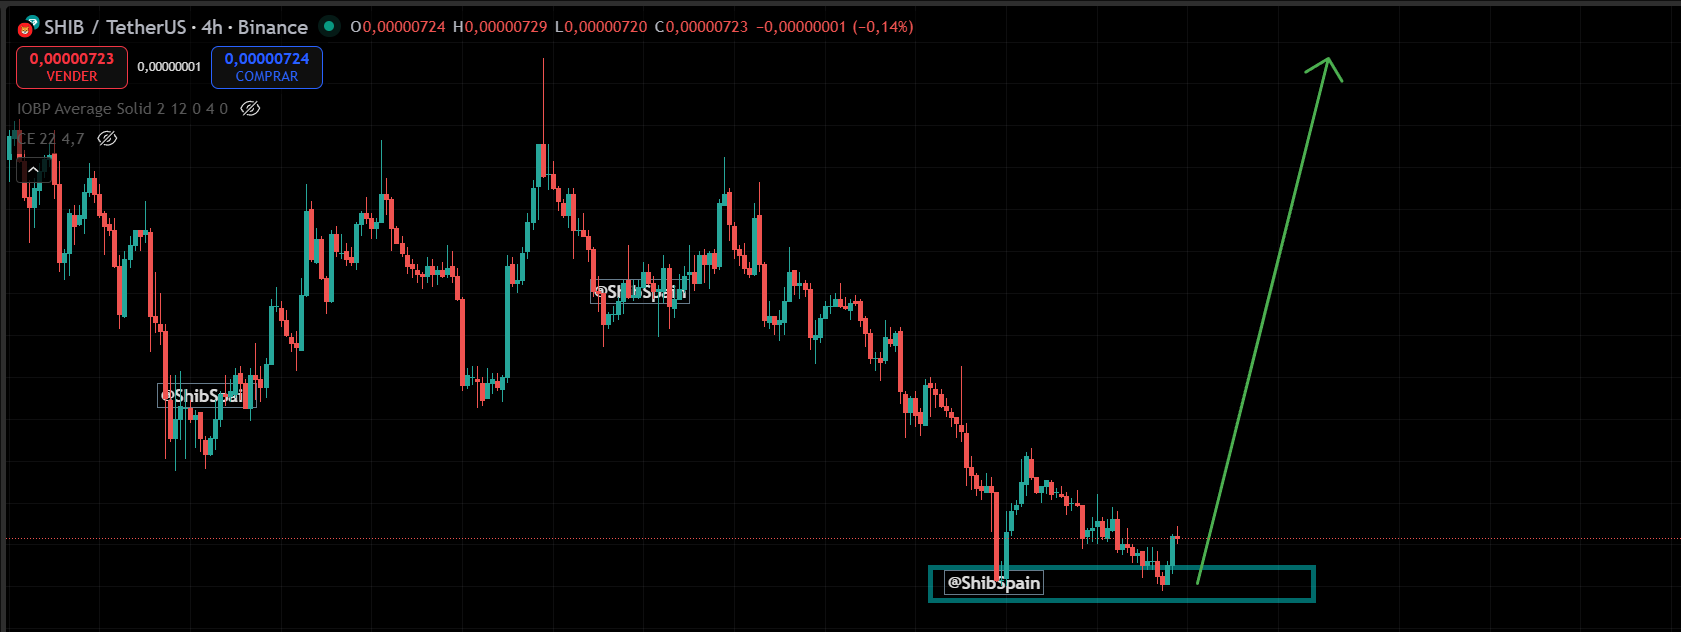
SHIB Tests Accumulation Zone After 4 Hour Slide
The SHIB USDT 4 hour chart on Binance shows Shiba Inu stabilizing near 0.00000723 after an extended decline that pushed price into a highlighted support band labeled as an accumulation zone.
The move followed a steady sequence of lower highs and lower lows, with sellers controlling most rebounds and forcing price back toward the same base area.
Traders often call an accumulation zone a price range where buying interest absorbs selling pressure after a drop.
In practice, it acts as a demand pocket where price repeatedly pauses, prints smaller candles, and starts to reject deeper lows.
When that base holds, SHIB can attempt a relief bounce. However, the bounce stays unconfirmed until price breaks its recent lower high on the 4 hour structure and then holds above it.
The chart shows a first reaction off the zone, but it does not confirm a reversal by itself.
SHIB still sits inside a broader downtrend on this timeframe, so any upside attempt needs follow through and a shift in market structure.
If price loses the accumulation band, the same area can flip into resistance, and the downtrend can resume.
Disclosure:This article does not contain investment advice or recommendations. Every investment and trading move involves risk, and readers should conduct their own research when making a decision.
Kriptoworld.com accepts no liability for any errors in the articles or for any financial loss resulting from incorrect information.

Tatevik Avetisyan is an editor at Kriptoworld who covers emerging crypto trends, blockchain innovation, and altcoin developments. She is passionate about breaking down complex stories for a global audience and making digital finance more accessible.
📅 Published: December 26, 2025 • 🕓 Last updated: December 26, 2025
