


Aave traded on Binance’s daily AAVEUSDT chart on Jan. 9, printing a close near $166 after a small rebound, yet the broader structure still points lower.
Price remains under a clear descending blue trendline that has capped rallies since the September peak, so sellers still control the main direction.
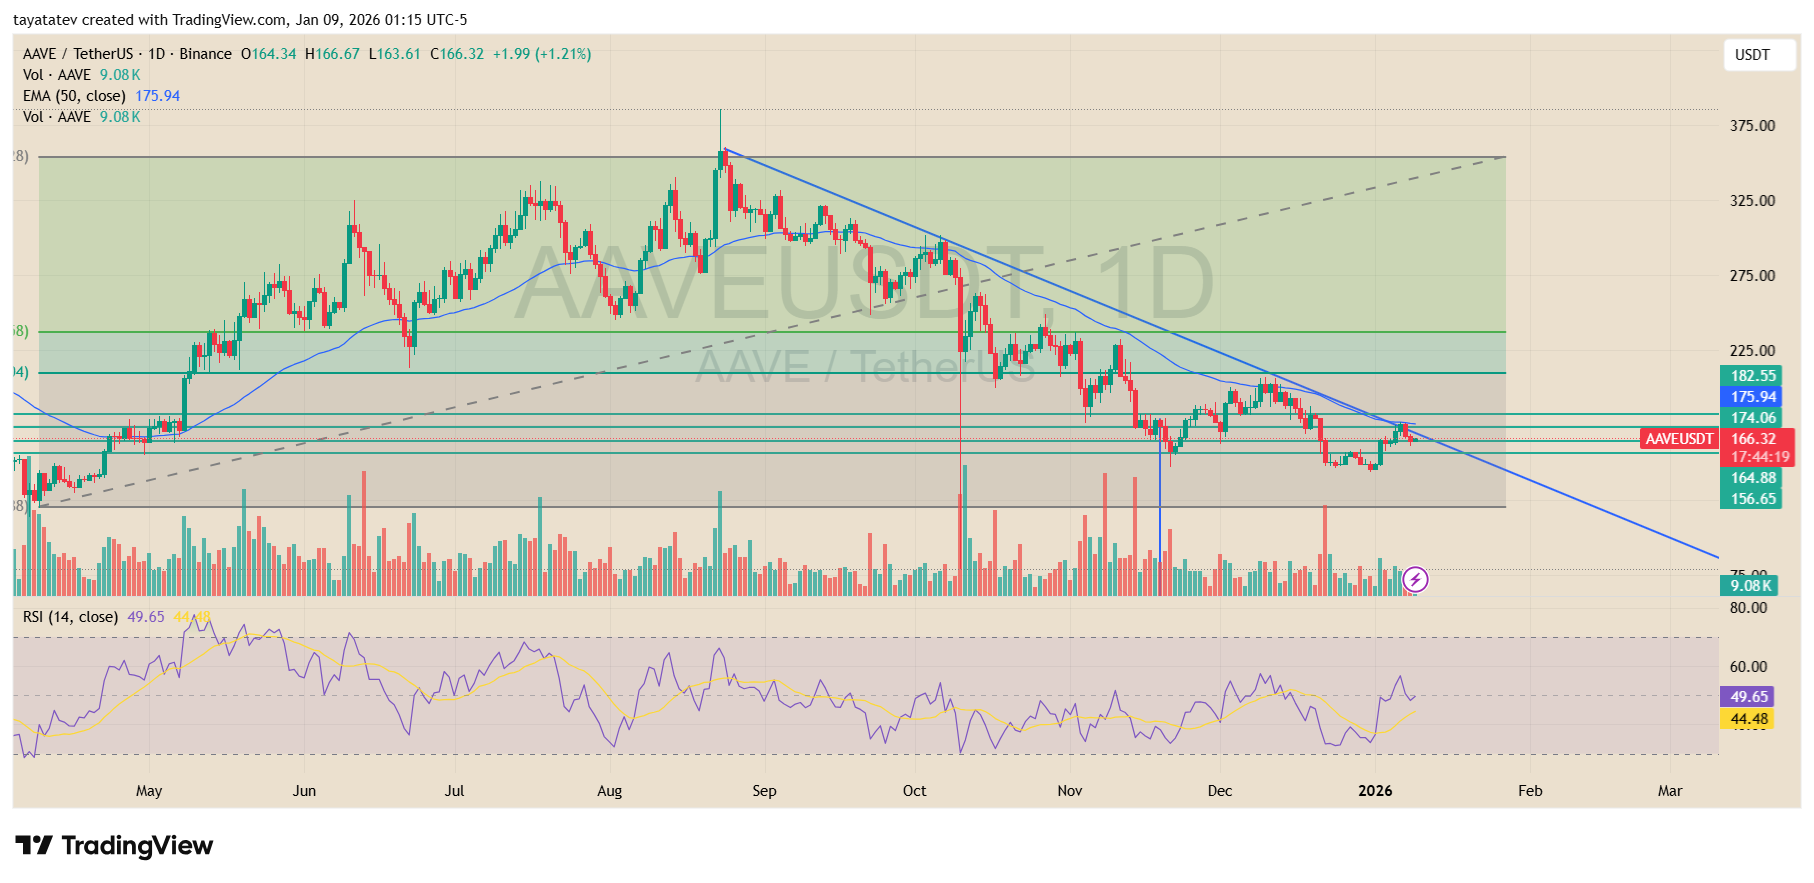
The chart shows AAVE trying to push up into that falling line, but it has not flipped it into support. Because of that, the move still looks like a bounce inside a downtrend, not a confirmed reversal.
For a reversal signal, AAVE needs a clean daily break and close above the blue trendline, and then it needs to hold above it on a retest. Without that sequence, the downtrend remains intact.
At the same time, AAVE trades below the 50 day EMA near $175.9, which adds another layer of overhead pressure.
A push above the trendline that also reclaims the 50 day EMA would strengthen the reversal case, because it would shift the market from lower highs into a more stable recovery structure.
On the downside, the $164 to $165 area sits as the nearest pivot zone after recent chop, while the lower band around $156.7 marks the clearer support level if sellers regain control.
On the upside, the market keeps watching the $174 area as the first reclaim point, with the next resistance zone higher near $182.6 if buyers manage to break the trendline and build follow through.
Momentum signals stay mixed rather than bullish. RSI sits near 50, which shows balance, yet it does not confirm a trend change on its own.
As a result, AAVE still trades in a downtrend until price breaks the blue line and proves it with a hold.
Stay ahead in the crypto world – follow us on X for the latest updates, insights, and trends!🚀
AAVE rebounds after a liquidity sweep, but bulls need follow through to reach the $190 to $205 zone
Aave traded near $170.7 on Binance’s daily AAVEUSDT chart as sellers pushed price lower on the session.
Even so, the setup highlights a rebound attempt after AAVE dipped into a lower support area and then bounced.
The chart marks that move as a sweep of sell side liquidity, followed by a shift in structure that traders often read as an early sign of a trend change.
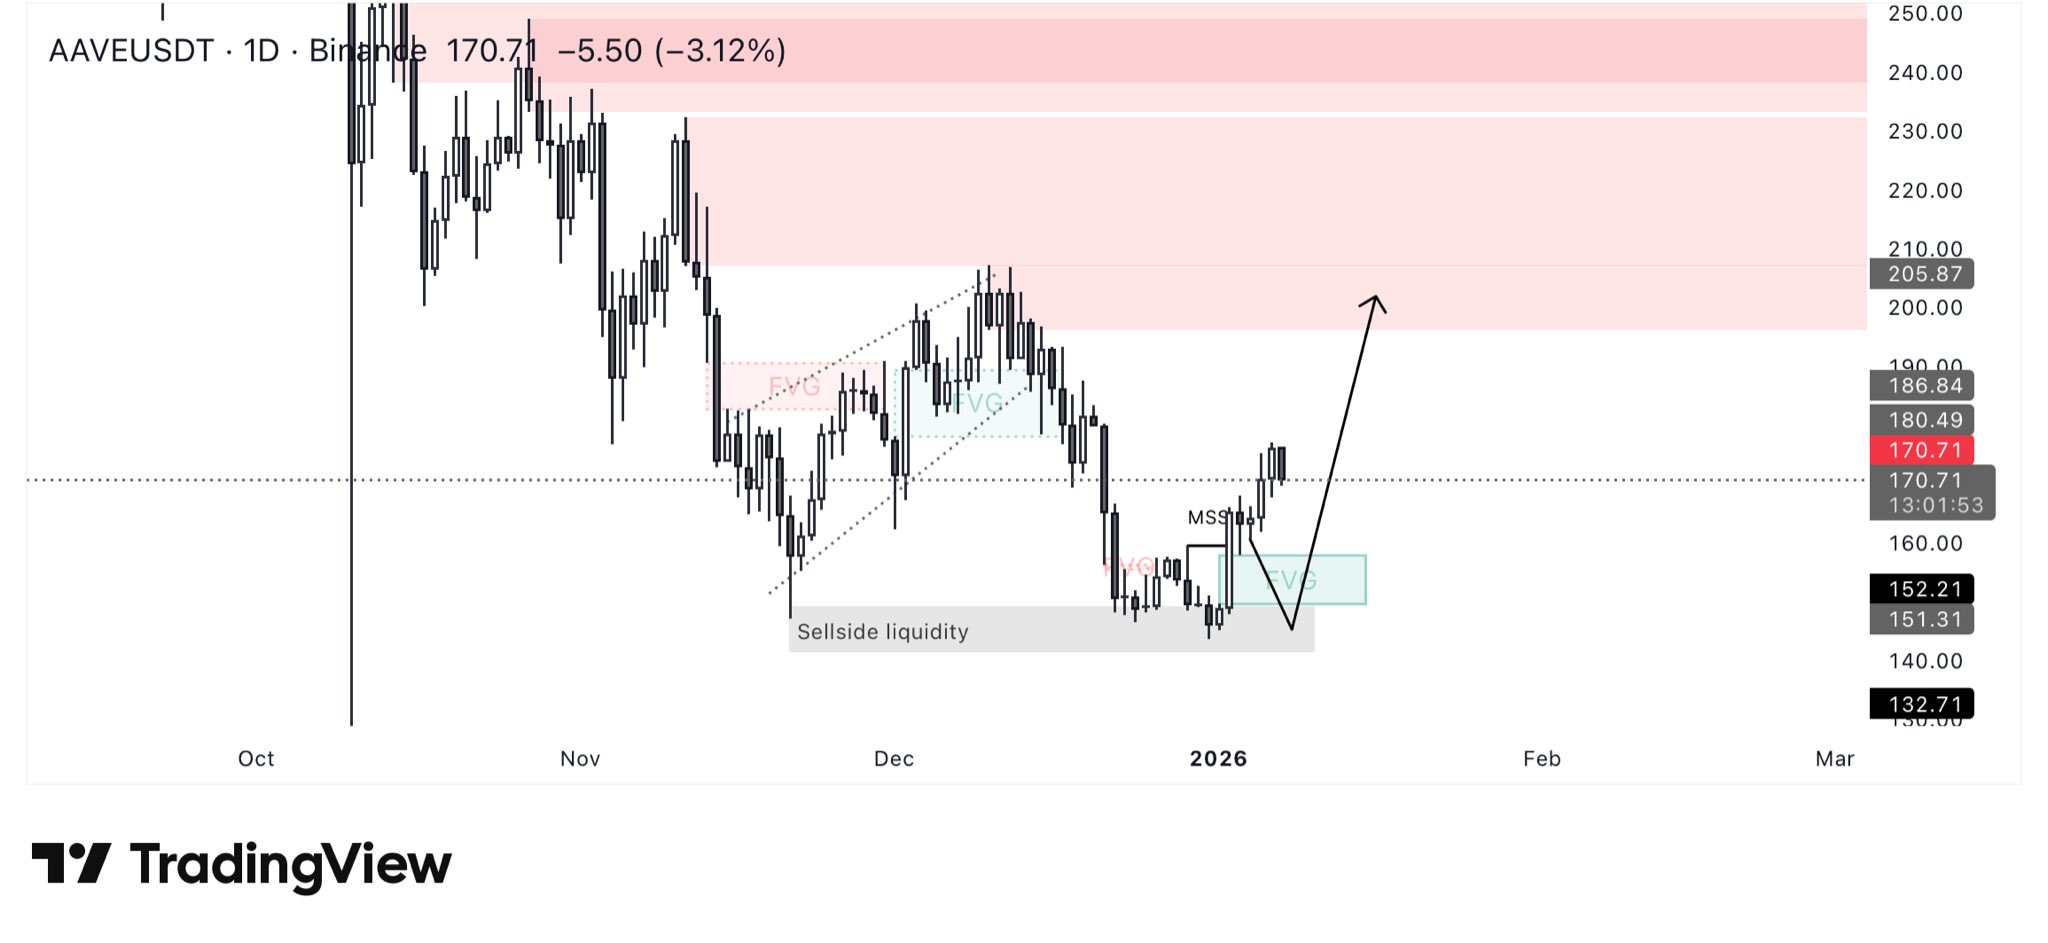
Price reacted from a highlighted bullish fair value gap zone near the recent lows, which suggests buyers stepped in where the market previously moved too fast to the upside.
As long as AAVE holds that reaction area, the bounce can keep building. However, the move stays fragile while price sits under nearby resistance levels and has not yet reclaimed the higher range that broke down earlier.
The first checks sit overhead around the $180 to $187 area shown on the scale, because that zone aligns with recent rejection points.
If AAVE pushes through that band and holds above it on a daily close, the next target becomes the $190 to $205 supply area that the chart highlights in red.
That region also lines up with the last heavy sell zone, so bulls need a strong close and follow through to keep momentum alive.
If price loses the rebound base instead, the bullish read weakens fast. The chart shows nearby downside markers around $152 to $151, which would come back into play if sellers force another breakdown.
In that case, the market would treat the bounce as a short lived pullback rather than the start of a sustained reversal.
Disclosure:This article does not contain investment advice or recommendations. Every investment and trading move involves risk, and readers should conduct their own research when making a decision.
Kriptoworld.com accepts no liability for any errors in the articles or for any financial loss resulting from incorrect information.

Tatevik Avetisyan is an editor at Kriptoworld who covers emerging crypto trends, blockchain innovation, and altcoin developments. She is passionate about breaking down complex stories for a global audience and making digital finance more accessible.
📅 Published: January 9, 2026 • 🕓 Last updated: January 9, 2026
