


Bitcoin continues to trade within a broader uptrend on the daily chart, even as short term consolidation limits upside momentum.
Price holds above the rising support trendline drawn from the December lows, which keeps the higher low structure intact.
Stay ahead in the crypto world – follow us on X for the latest updates, insights, and trends!🚀
At the same time, Bitcoin remains below a descending resistance line that has capped rebounds since the November peak, signaling that the market is still working through a corrective phase rather than starting a full reversal.
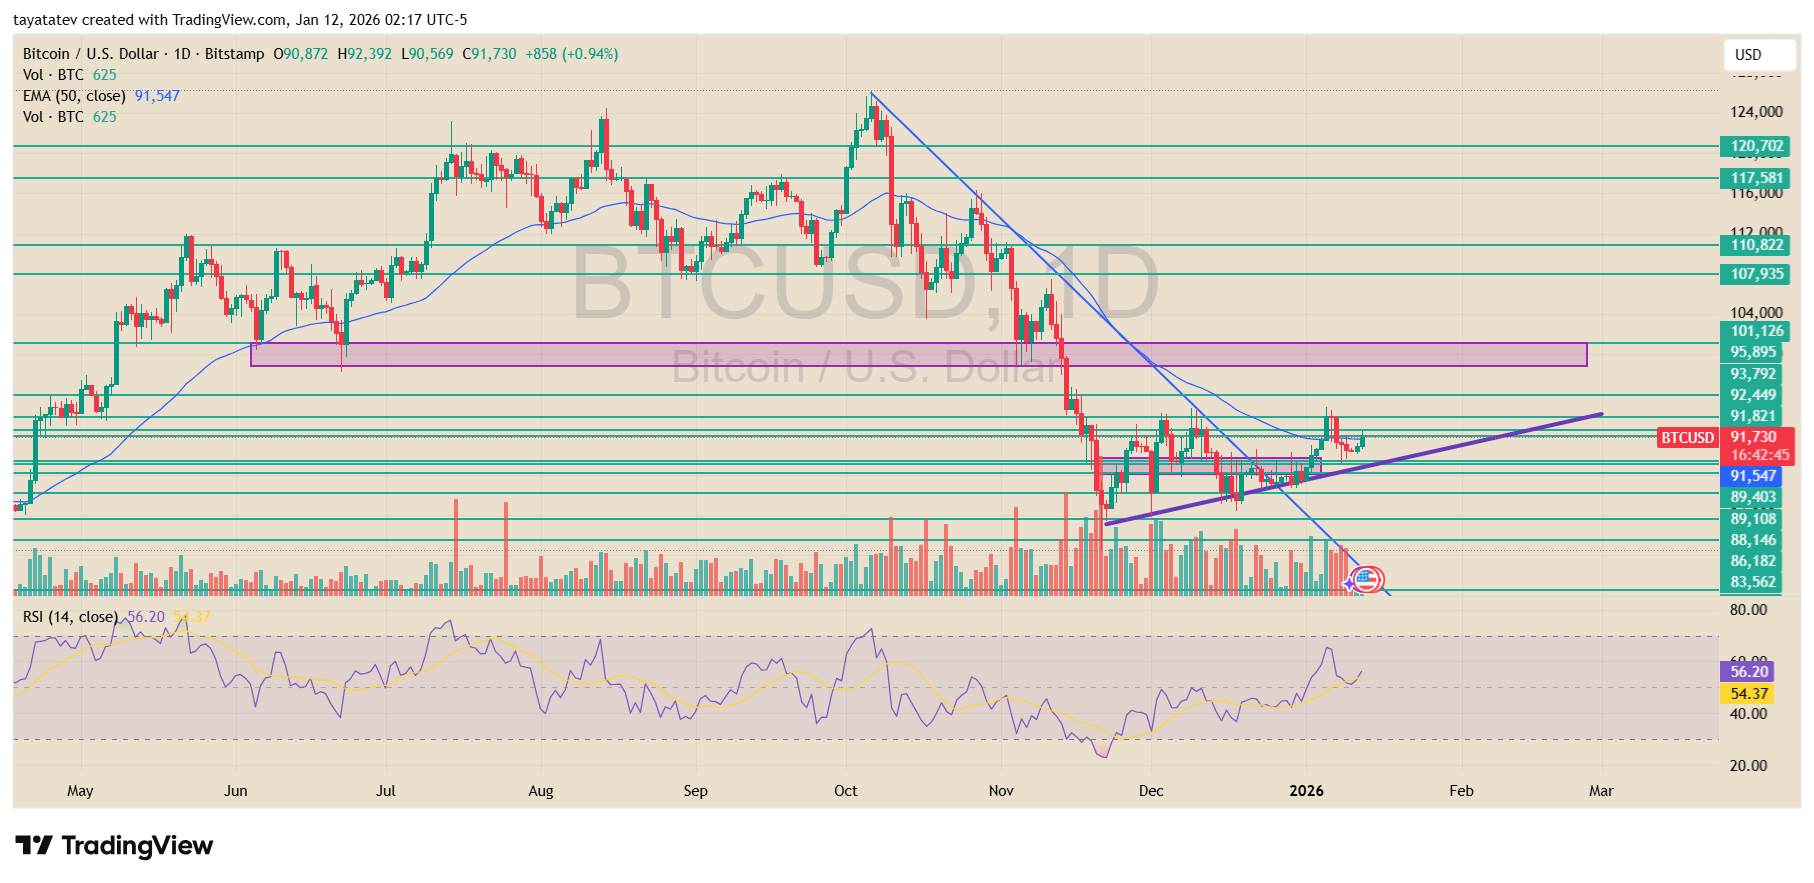
Price action shows Bitcoin stabilizing around the $91,000–$92,000 area after a sharp selloff earlier in December.
This zone overlaps with multiple horizontal levels that previously acted as resistance and later flipped into support.
As a result, buyers have repeatedly stepped in near this range, preventing deeper pullbacks.
Meanwhile, volume has cooled compared with the capitulation phase, suggesting reduced selling pressure rather than aggressive distribution.
The broader trend remains constructive, but confirmation of a trend reversal requires a stronger move.
Bitcoin needs to reclaim the $101,000 level on a daily closing basis to signal that bullish control has returned.
That area aligns with prior structural support turned resistance and sits near the midpoint of the previous breakdown.
Until price clears and holds above that zone, the current recovery remains a corrective bounce within the larger trend.
Momentum indicators reflect this balance. The daily RSI has moved back above the mid 50 level, showing improving momentum, yet it remains well below overbought conditions.
This positioning supports the view that Bitcoin is recovering but not accelerating into a new impulse leg. As long as price respects the rising support and avoids a breakdown below recent higher lows, the broader uptrend stays intact.
However, only a sustained push above $101,000 would shift the structure from recovery to confirmed reversal.
Bitcoin Heatmap Shows Liquidity Reset as BTC Holds Near VWAP
Bitcoin traded near $92,000 on the 4 hour BTC USD Binance chart as the liquidation heatmap showed fresh liquidity forming above and below current price.
Meanwhile, the brighter bands on the map clustered around the mid to upper $90,000s and the mid $80,000s, which often marks where forced orders can concentrate if price expands.
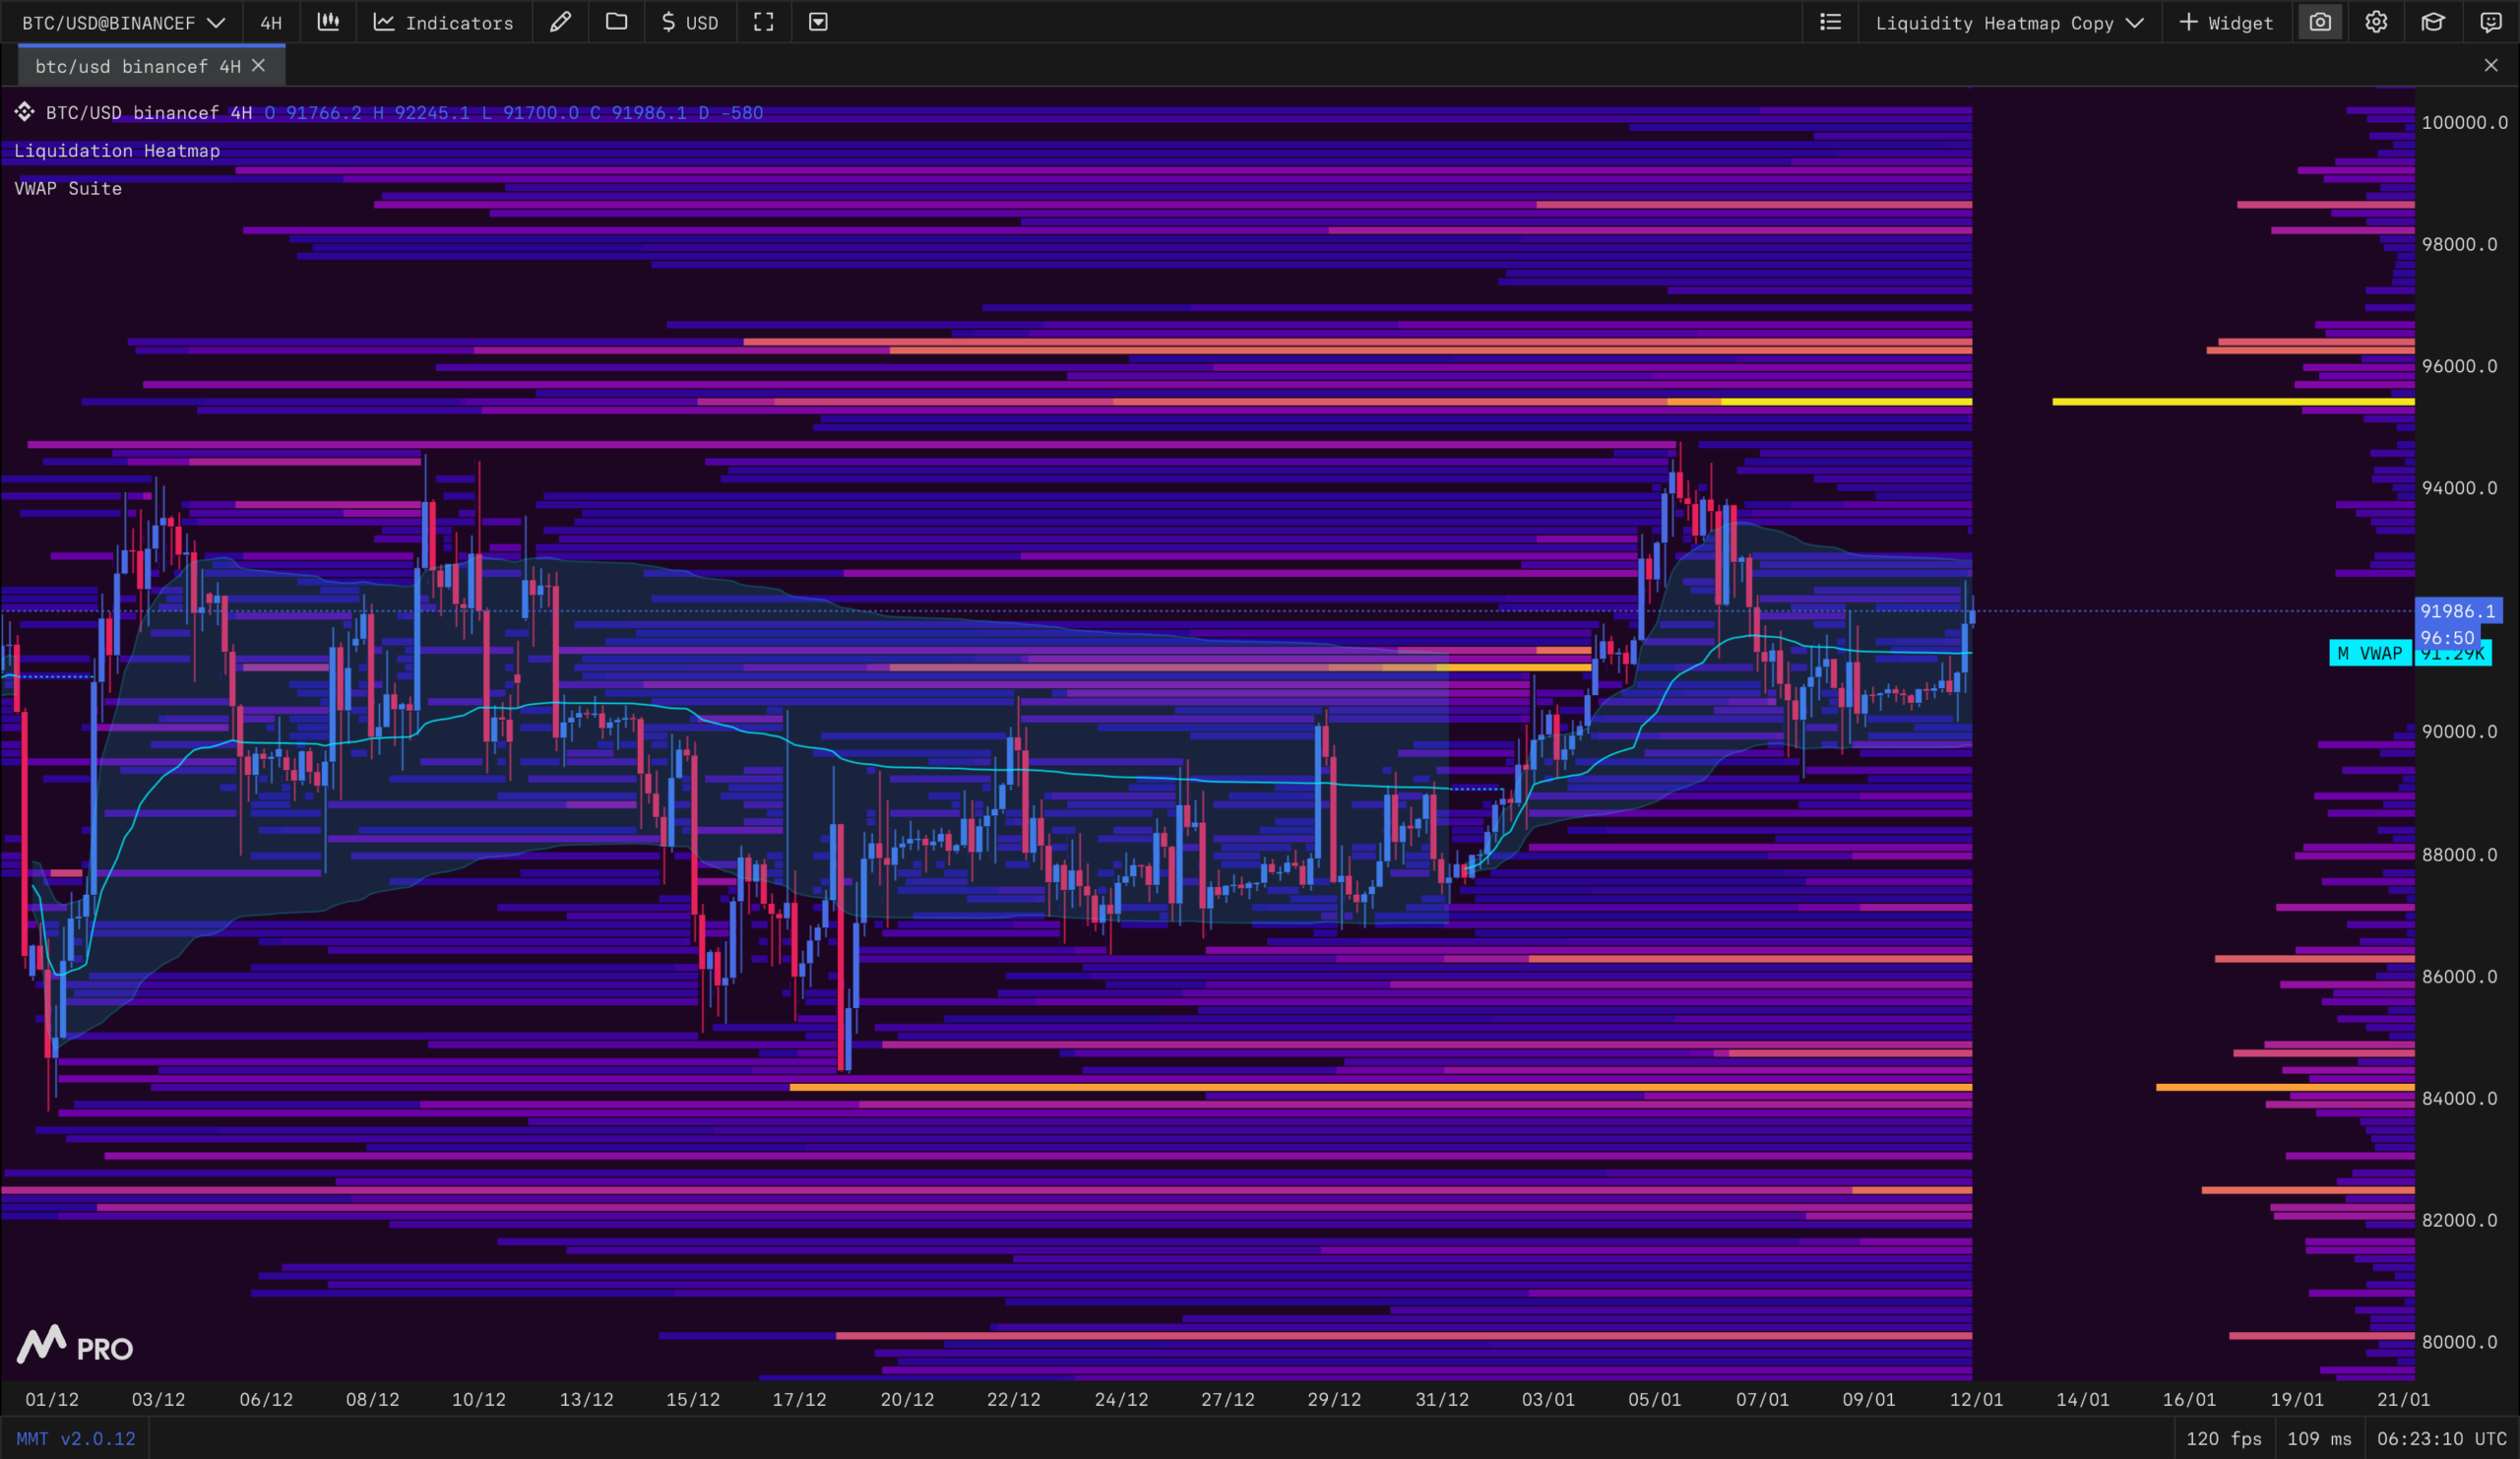
The heatmap suggests local liquidity has already been cleared around the recent range, which matches the sharp swings seen earlier in January.
After that sweep, price tightened and moved back toward the VWAP area, showing a more balanced zone where buyers and sellers repeatedly meet.
As a result, the chart shifted from wide chop to a narrower structure that can precede a directional move.
Liquidity now looks clearer, with heavier lines sitting above current levels near roughly $95,000 to $96,000 and another pocket lower near roughly $84,000 to $85,000.
Because price often reacts to dense liquidation zones, a break and hold beyond the nearest band could signal that Bitcoin has started to “commit” rather than keep ranging.
Until then, the heatmap supports the idea that the chop phase is late stage, while price action still needs a decisive push to confirm direction.
Disclosure:This article does not contain investment advice or recommendations. Every investment and trading move involves risk, and readers should conduct their own research when making a decision.
Kriptoworld.com accepts no liability for any errors in the articles or for any financial loss resulting from incorrect information.

Tatevik Avetisyan is an editor at Kriptoworld who covers emerging crypto trends, blockchain innovation, and altcoin developments. She is passionate about breaking down complex stories for a global audience and making digital finance more accessible.
📅 Published: January 12, 2026 • 🕓 Last updated: January 12, 2026
