


Solana traded near $144.39 on the daily Coinbase chart dated Jan. 14, 2026, after printing a session range from about $143.80 to $146.51.
Price has been rising in early 2026, and the structure shows higher lows along a rising trendline, which points to an active short term uptrend.
Stay ahead in the crypto world – follow us on X for the latest updates, insights, and trends!🚀
The next clear ceiling sits near $154.25, a level marked on the chart as the nearest resistance zone.
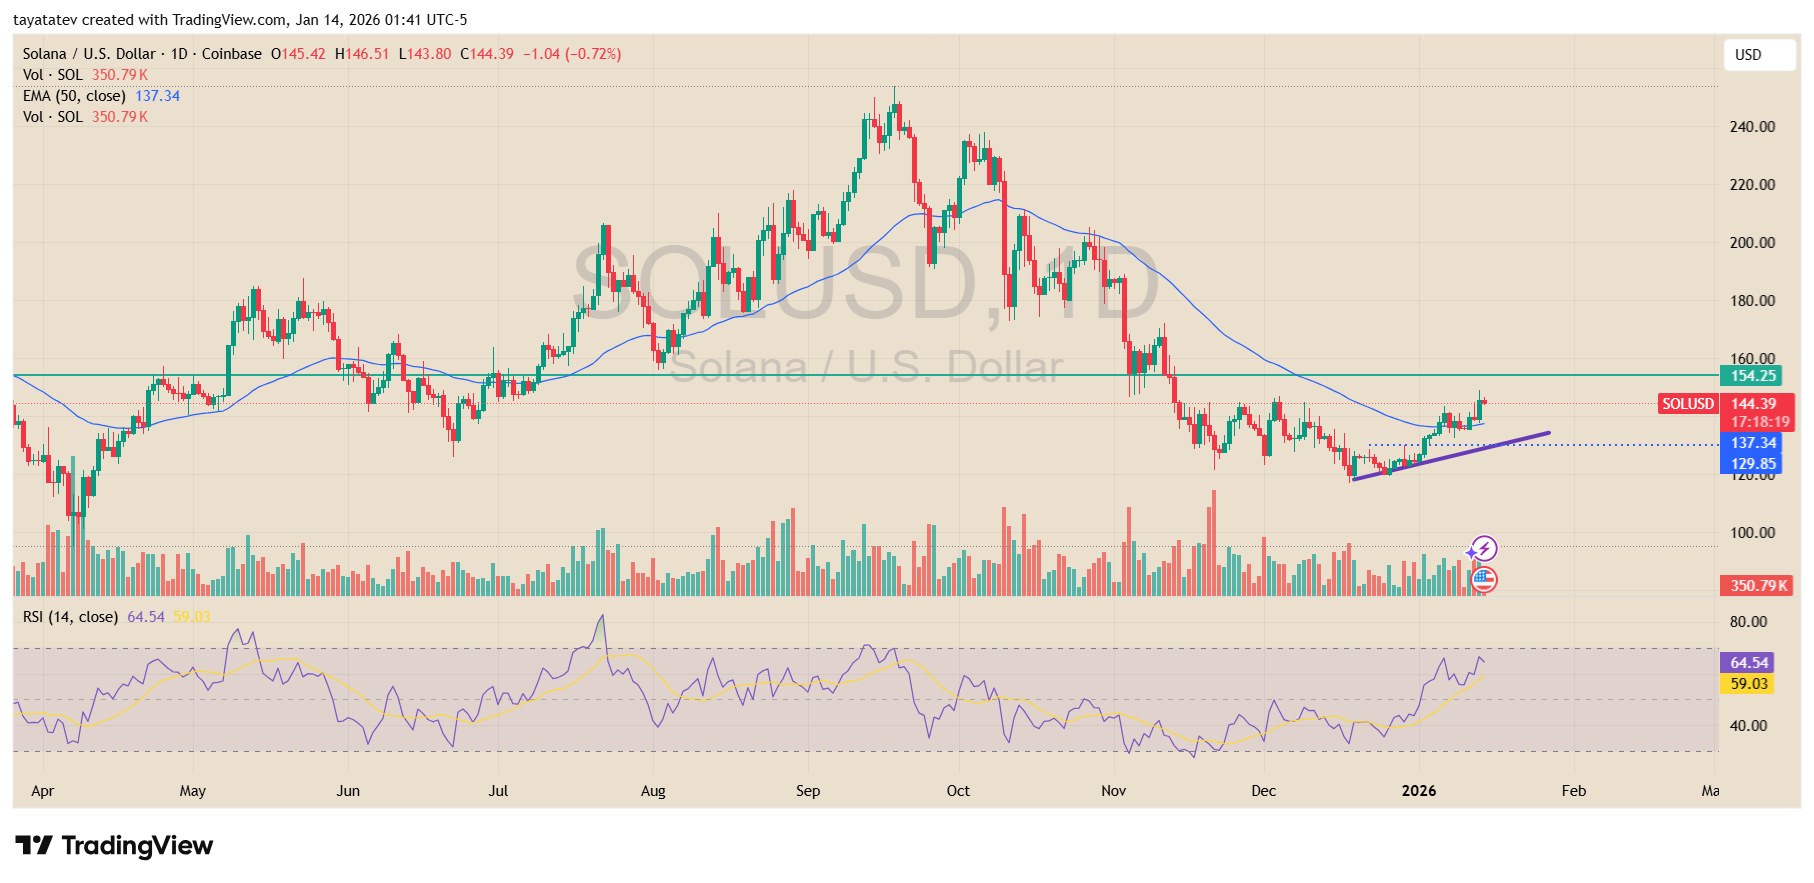
That resistance matters because it sits above the latest rebound swing and lines up with the prior breakdown area from late 2025.
If SOL pushes above the current zone and then holds above it on a daily close, the chart opens room toward the $154 area.
If price clears $154 and follows with another clean break higher, the move would add confirmation that the recent advance is shifting from a bounce into a broader reversal attempt.
Trend support sits around the rising base near $129.85, where the latest higher low formed before the current push. A drop back below that rising support would weaken the uptrend and raise the risk of a deeper retest.
Between those levels, the 50 day exponential moving average sits near $137.34, and SOL is trading above it, which keeps the near term bias pointed upward while that average holds.
Momentum also supports the rebound. The 14 day RSI reads about 64.54, which signals strengthening demand without an extreme reading.
Volume showed about 350.79K SOL on the session, and follow through with similar activity would matter most if SOL challenges the $154 resistance again.
Solana holds long accumulation range after nearly 700 days
Solana continues to trade inside a long consolidation structure that has been developing for almost 700 days, based on the three day SOL USDT chart from Binance dated Jan. 14, 2026.
Price is currently moving within a broad horizontal range, with repeated reactions between a defined lower support zone and a capped resistance area above.
This structure shows extended accumulation rather than a completed trend move.
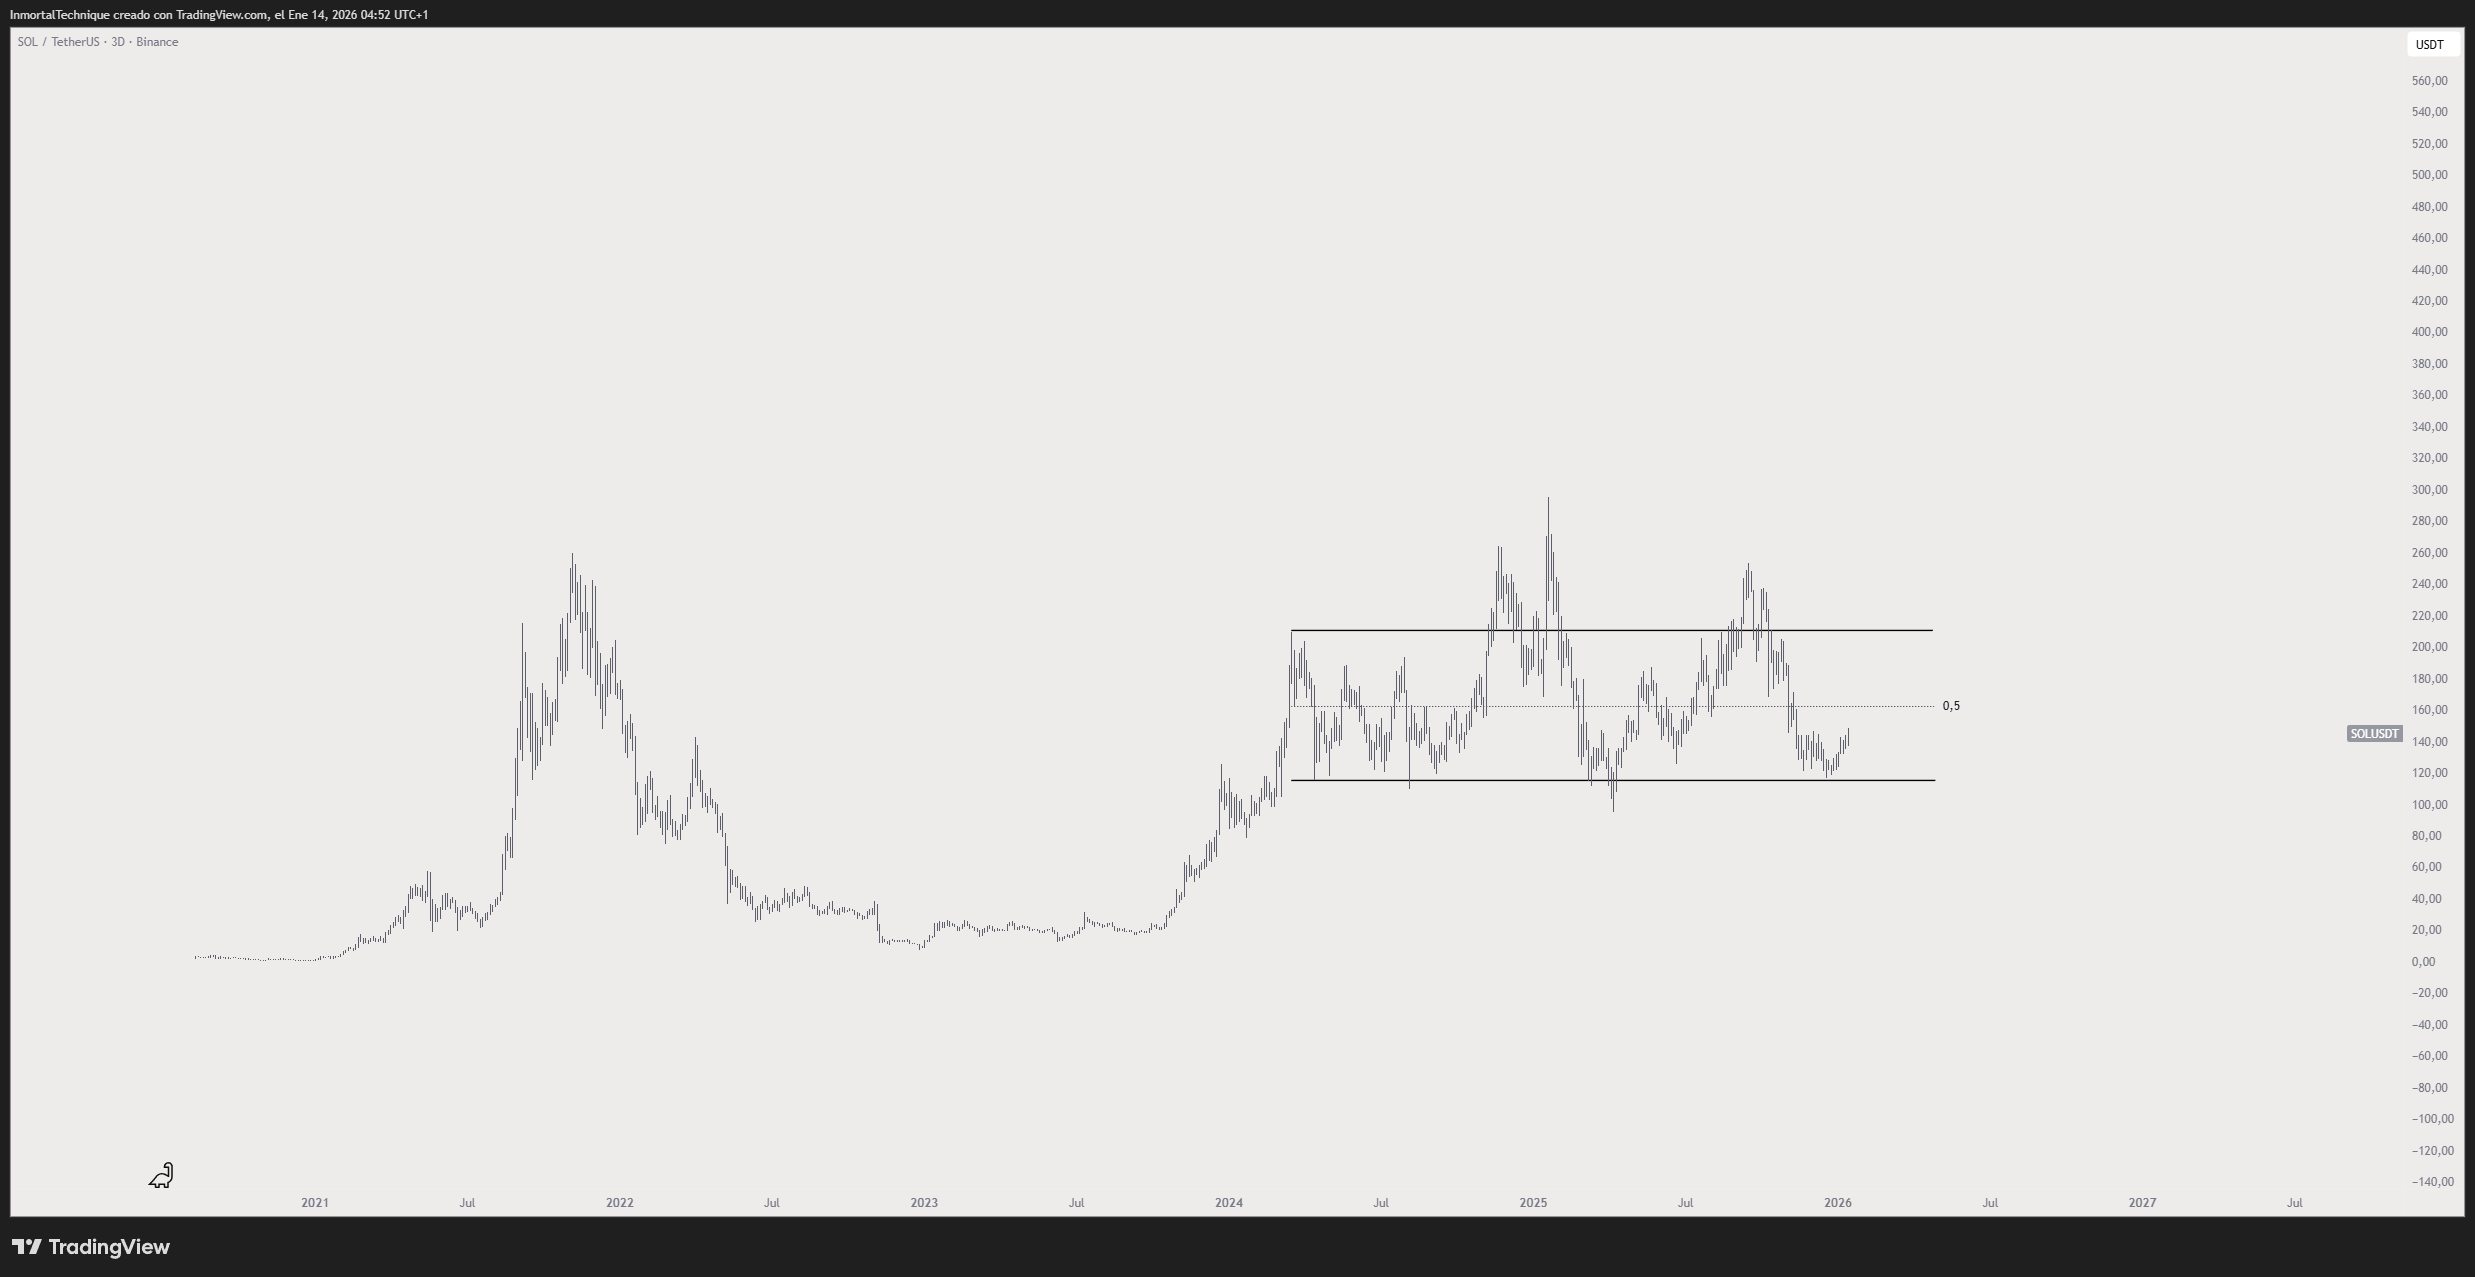
The chart highlights a clear range floor, where downside attempts repeatedly stalled and reversed. Each dip into this zone attracted demand, which kept price from breaking lower for an extended period.
At the same time, upside moves consistently failed near the same resistance band, showing that sellers remain active at higher levels. This balance explains the prolonged sideways behavior following the prior impulsive rally.
Despite the range, recent price action shows improving structure. Solana has been forming higher reactions off the lower boundary, which signals growing pressure within the range.
As long as price holds above the established support area, the broader accumulation structure stays intact.
The midpoint of the range now acts as a short term pivot, separating weak rebounds from stronger continuation attempts.
A decisive break above the upper range resistance would mark a structural shift. Such a move would confirm that accumulation is resolving to the upside and would open the door for a broader trend continuation.
Until that break occurs, price action still reflects consolidation, not expansion, even though the longer term base continues to build.
Disclosure:This article does not contain investment advice or recommendations. Every investment and trading move involves risk, and readers should conduct their own research when making a decision.
Kriptoworld.com accepts no liability for any errors in the articles or for any financial loss resulting from incorrect information.

Tatevik Avetisyan is an editor at Kriptoworld who covers emerging crypto trends, blockchain innovation, and altcoin developments. She is passionate about breaking down complex stories for a global audience and making digital finance more accessible.
📅 Published: January 14, 2026 • 🕓 Last updated: January 14, 2026
