


Bitcoin eyes $100K like a junkie chasing the next fix, but a sharp-eyed trader says brace for a gut-punch drop to $60,000 by late 2026.
TradingShot’s fresh TradingView chart screams correction ahead, blending halving cycles, moving averages, and Fibonacci tricks. History whispers this ain’t no blip.
Stay ahead in the crypto world – follow us on X for the latest updates, insights, and trends!🚀
Bitcoin Cycle Model Flags $60K Floor
That daily 200-day MA looms like a guillotine, historically kicking off deep bear legs after rejection.
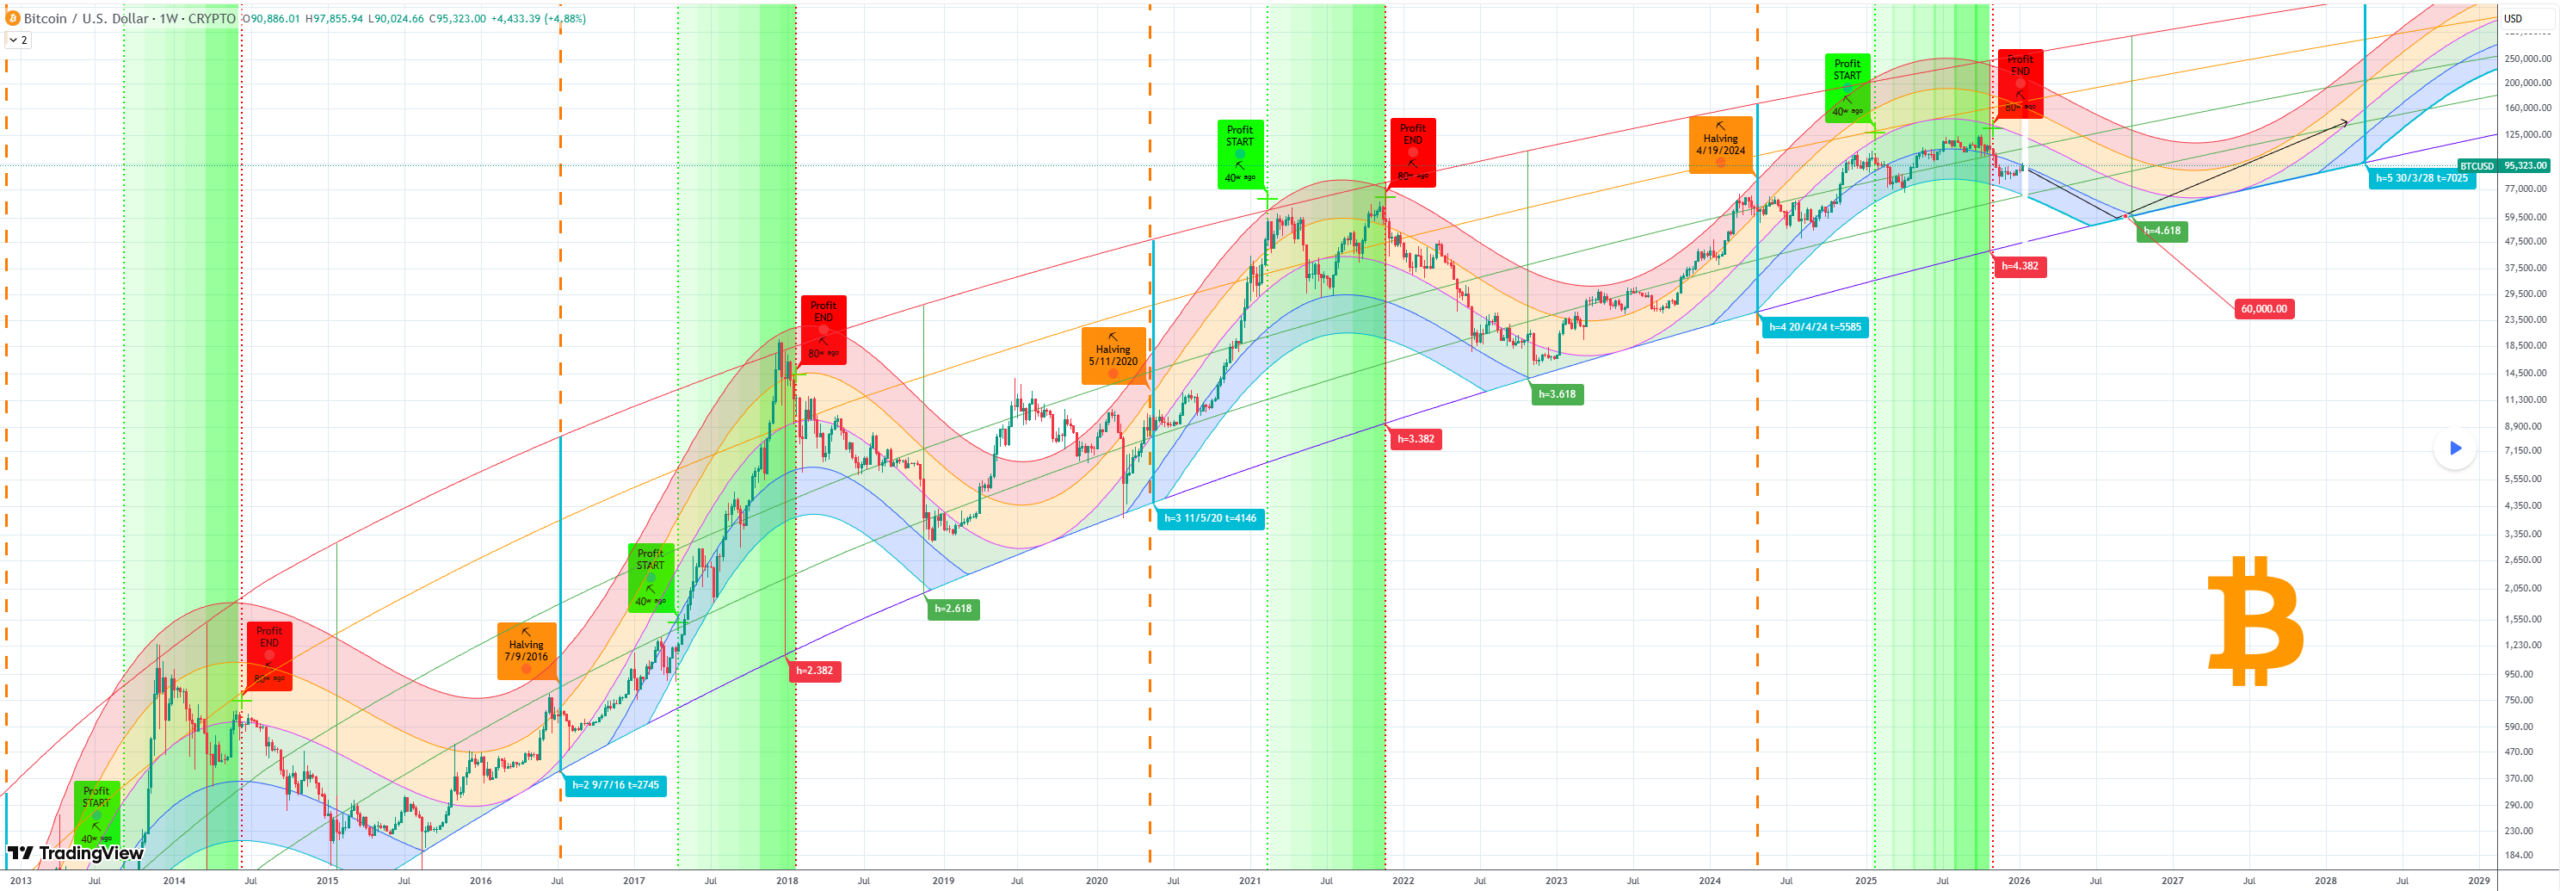
Rainbow cycle chart lines up price with halvings and Fibonacci time extensions, zeroing on a 4.618 stretch in September 2026’s last week, so the model spits $60K as the pit, way before the April 2028 halving profit party.
Cycles shrink gains each round, that’s well known, Bitcoin skipped the $150K orange rainbow band this time, screaming diminishing highs. Pullbacks stretch, not snap back.
Rewind to 2022’s crypto winter, when Bitcoin plunged 75% from $69K to $16K post-halving, wiping $2 trillion off markets amid FTX flames. Or 2018’s 84% bloodbath from $20K, Fibonacci lows nailed the bottom.
Unfortunately, TradingShot’s call fits this grim pattern, $60K crash would slash half from peaks yet keep the long bull alive, underscoring why cycle models still rule volatile crypto rodeos.
Bitcoin Price Action Turns Sour Fast
Bull hype flared this week, institutional cash flooded after busting $90K consolidation, spiking near $98K.
Short squeezes loomed, $100K dreams danced. Momentum? Fizzled like cheap fireworks. Now weakness creeps, eyeing low-$90Ks.
50-day SMA at $90,095 sits below price, hinting short-term push. But 200-day at $105,657 towers overhead, bear growl in the distance.
14-day RSI chills at 63.30, which is neutral, no overbought panic, room to climb before flips.
Why This Bitcoin Warning Hits Hard
Because it’s painful, that’s why. Failure to blast $150K? Cycle fatigue. Model eyes distribution flipping to retrace hell.
Far from 2028 halving, plenty runway for pain. So, traders, watch that 200-day MA like a hawk, rejection likely means $60K hellride. Hello darkness, my old friend?
Famous, or infamous old-school tools like rainbows and Fibs keep nailing Bitcoin’s swings, so worth keeping an eye on as $100K teases fade.
This ain’t doomsaying, but more like cycle clockwork, prepping smart money for the dip.
Disclosure:This article does not contain investment advice or recommendations. Every investment and trading move involves risk, and readers should conduct their own research when making a decision.
Kriptoworld.com accepts no liability for any errors in the articles or for any financial loss resulting from incorrect information.
Cryptocurrency and Web3 expert, founder of Kriptoworld
LinkedIn | X (Twitter) | More articles
With years of experience covering the blockchain space, András delivers insightful reporting on DeFi, tokenization, altcoins, and crypto regulations shaping the digital economy.
📅 Published: January 18, 2026 • 🕓 Last updated: January 18, 2026
✉️ Contact: [email protected]
