


BNB pulled back after a failed breakout above $928, according to a chart shared on X by Mr. CryptoCeek on Jan. 21.
The Binance BNBUSDT daily chart showed price near $889, after the market rejected a push into the high-$900s and returned to a rising support line that has guided the latest rebound.
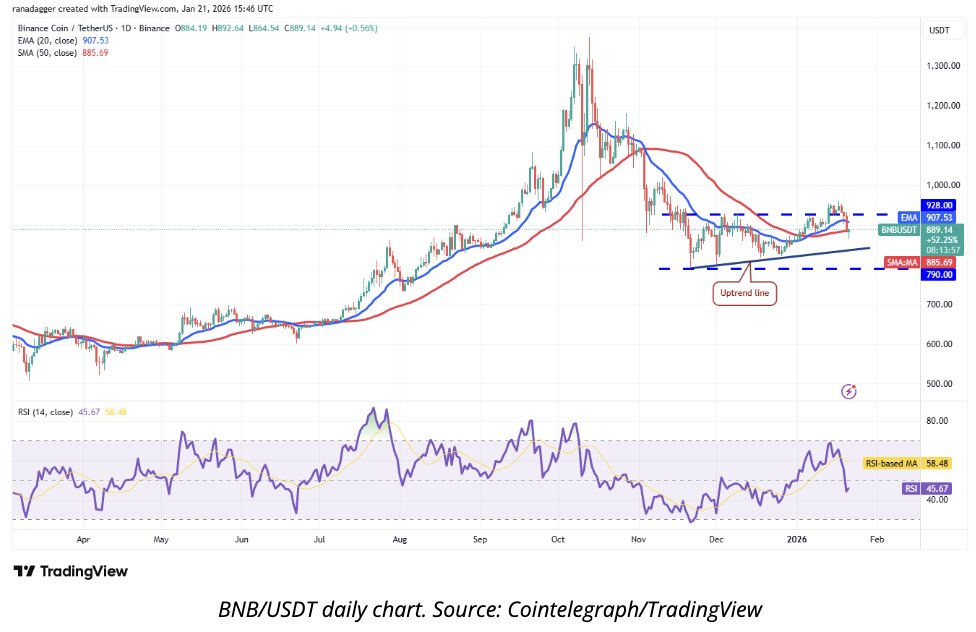
The same chart placed the 20 day EMA near $907 and the 50 day SMA near $886, leaving BNB trading below the faster average and right on top of the slower one.
That setup signals weakening short term momentum while the market tests whether the broader uptrend still holds.
Meanwhile, the daily RSI sat near 46, which kept momentum in the lower half of its range after a recent rollover.
Next, downside risk increases if BNB loses the trendline and starts closing below the $885 area with follow through. In that case, the chart’s next major level sits near $790, which marks the lower boundary of the recent range.
However, buyers can still regain control if price rebounds, reclaims $928, and then clears about $959, which the post described as the level that would reopen the path toward a measured move target near $1,087.
As a result, BNB sits in a tight decision zone, where a clean break in either direction can expand daily swings quickly.
BNB Bear Flag Forms on 4 Hour Chart as Price Tests Key Support
BNB slid back to the lower end of its recent structure after failing to hold a push into the mid $900s, according to a TradingView chart shared by Chill Trader on X on Jan. 21.
The 4 hour BNB perpetual futures chart on Binance showed price near $882, with the latest move turning lower after tapping a marked resistance zone around $949 to $958.
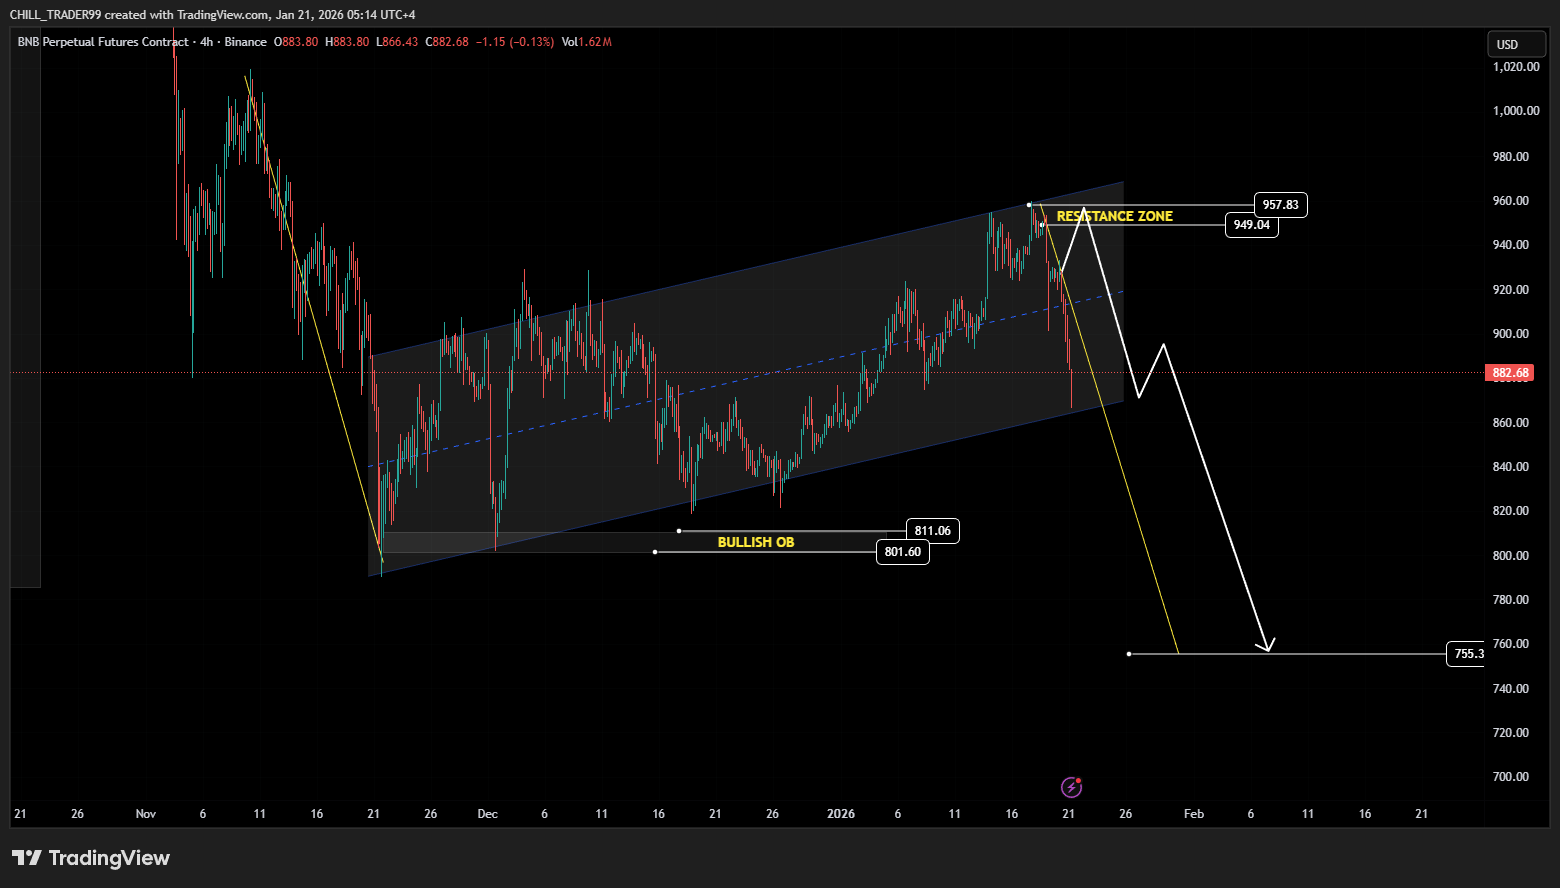
The chart framed the recent action as a bear flag, with price rising inside an upward sloping channel before rolling over near the top boundary.
As selling picked up, candles moved toward the channel’s midline and lower edge, putting focus on whether the pattern resolves lower.
If price breaks beneath the channel support and fails to reclaim it, the chart’s projected path points toward the low $800s first, where a labeled bullish order block sits around $801 to $811.
If that demand zone does not hold on a retest, the downside projection extends toward roughly $755, which the chart marked as the deeper target area.
However, the bearish setup weakens if BNB stabilizes at current support and then reclaims the $900 area with follow through, because that would shift pressure back toward the $949 to $958 resistance band that capped the last advance.
Disclosure:This article does not contain investment advice or recommendations. Every investment and trading move involves risk, and readers should conduct their own research when making a decision.
Kriptoworld.com accepts no liability for any errors in the articles or for any financial loss resulting from incorrect information.

Tatevik Avetisyan is an editor at Kriptoworld who covers emerging crypto trends, blockchain innovation, and altcoin developments. She is passionate about breaking down complex stories for a global audience and making digital finance more accessible.
📅 Published: January 22, 2026 • 🕓 Last updated: January 22, 2026
