


Bitcoin sold off hard in the last 24 hours, sliding from the $88,000–$89,000 area and then breaking down fast toward $82,700 on the 4 hour BTCUSD Bitstamp chart.
Selling picked up after price lost the 50 period EMA near $88,200, and the move intensified once BTC fell through the rising purple trendline that had supported price through mid to late January.
Stay ahead in the crypto world – follow us on X for the latest updates, insights, and trends!🚀
After that break, buyers failed to push price back above $88,000, so the drop extended through the next marked level near $86,200 and into the low $83,000s.
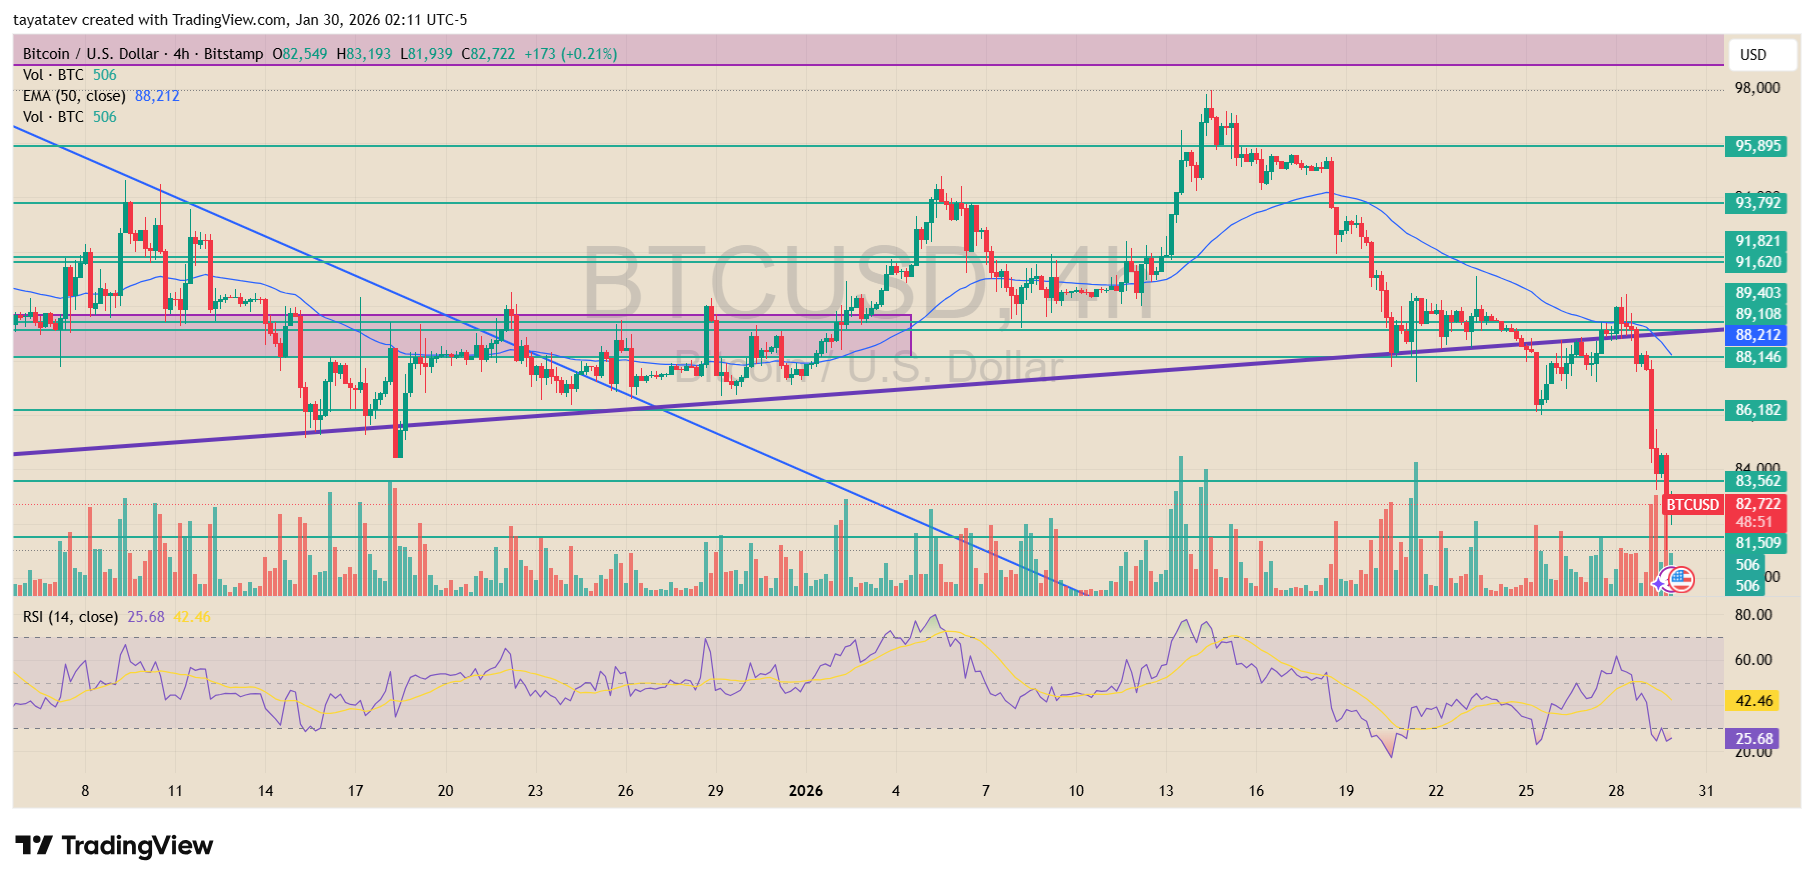
Volume confirmed the weakness. Red volume bars expanded during the breakdown, which points to active selling rather than a slow fade.
Earlier spikes in volume also showed up near local highs, and then price rolled over, which often happens when buyers lose momentum and sellers step in with size.
As price fell, the market did not print a strong rebound candle that could reset the structure, so the slide stayed one directional into the close.
Momentum indicators also flipped bearish. RSI on the 4 hour timeframe fell to about 25, placing Bitcoin in oversold territory.
However, the RSI did not show a clear bullish divergence on this view, so the oversold signal alone does not confirm a reversal.
Instead, it mainly shows that the selloff stretched quickly and could trigger short covering bounces if price finds a firm support zone.
From here, the chart highlights two nearby decision areas. Support sits around $81,500, a level marked on the right scale and tied to prior reactions.
If BTC breaks and holds below that area, the next round number at $80,000 becomes the next obvious magnet.
On the upside, the first resistance sits at $88,100–$88,200, where the 50 period EMA and the broken structure meet.
If BTC reclaims that zone and holds it, then $89,100, $91,600, and $93,700 become the next resistance steps from the prior range.
Until that happens, the short term structure stays weak because price trades below the EMA, below the broken trendline, and below multiple former supports that now act as overhead supply.
Meanwhile, Bitcoin Cycle Comparison Fuels $32,000 Drawdown Narrative
The chart compares Bitcoin’s past market cycles and argues that the current decline fits a repeating long term pattern.
It plots three major peaks, near $19,000 in 2017, $69,000 in 2021, and a projected $126,000 peak marked for 2025.
In each cycle, price topped along a rising long term trendline and then entered a deep bear market that erased more than 70 percent of value.
Based on this structure, the chart highlights a potential downside zone near $32,000 for 2026.
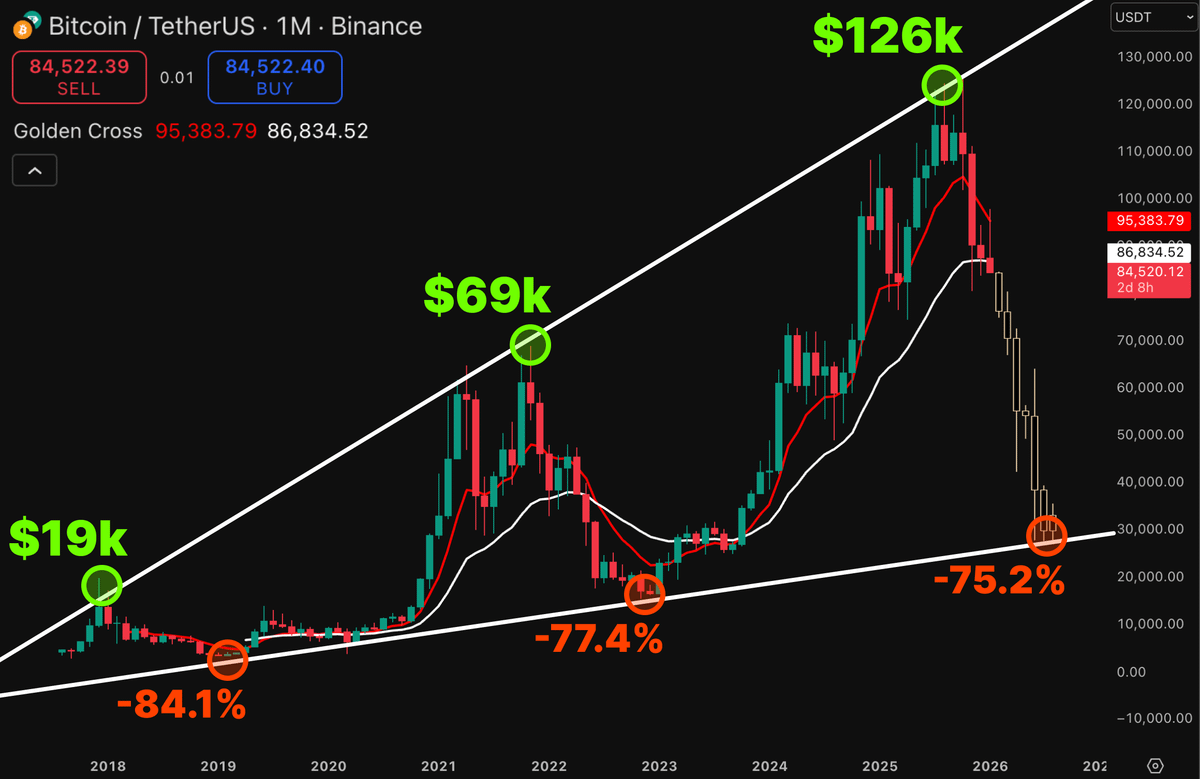
The historical drawdowns shown are consistent in scale but not identical. After the 2017 peak, Bitcoin fell about 84 percent into 2018.
Following the 2021 top, price dropped roughly 77 percent into the 2022 low. The current projection assumes a smaller, but still severe, decline of around 72 percent from the $126,000 peak.
This creates a visual pattern of diminishing percentage losses while still respecting the same rising macro support line that has held across multiple cycles.
From a structure perspective, the chart emphasizes how each bear market low formed near the lower white trendline.
Those lows aligned with long term support rather than random price levels. The current projection places the next potential low slightly above that trendline, which reflects the idea of slowing downside momentum over time rather than a full structural break.
This framing supports the argument that Bitcoin remains inside a long term rising channel despite violent cyclical corrections.
Momentum context also matters. The chart uses moving averages to show how price tends to roll over after extended upside runs.
In prior cycles, once price lost key moving average support after the peak, downside accelerated quickly.
The current selloff, as shown on the right side of the chart, already reflects that behavior, with price pulling away from the highs and moving toward lower historical ranges.
However, the analysis remains based on symmetry rather than confirmation. The chart assumes the $126,000 level represents a completed cycle top and that historical percentages will continue to guide future declines.
While the long term trendline and past drawdowns provide context, they do not confirm timing or depth.
As shown historically, Bitcoin can spend long periods consolidating before final lows form, even when macro patterns appear similar.
Disclosure:This article does not contain investment advice or recommendations. Every investment and trading move involves risk, and readers should conduct their own research when making a decision.
Kriptoworld.com accepts no liability for any errors in the articles or for any financial loss resulting from incorrect information.

Tatevik Avetisyan is an editor at Kriptoworld who covers emerging crypto trends, blockchain innovation, and altcoin developments. She is passionate about breaking down complex stories for a global audience and making digital finance more accessible.
📅 Published: January 30, 2026 • 🕓 Last updated: January 30, 2026
