


Bitcoin fell sharply over the weekend, extending its recent downtrend and breaking below several technical levels on the daily chart.
On the Bitstamp feed, BTC dropped to around $75,200 by early Monday after trading near the mid-$80,000 range late last week.
Stay ahead in the crypto world – follow us on X for the latest updates, insights, and trends!🚀
The move marked a clear acceleration in selling pressure, with price closing well below prior consolidation zones.
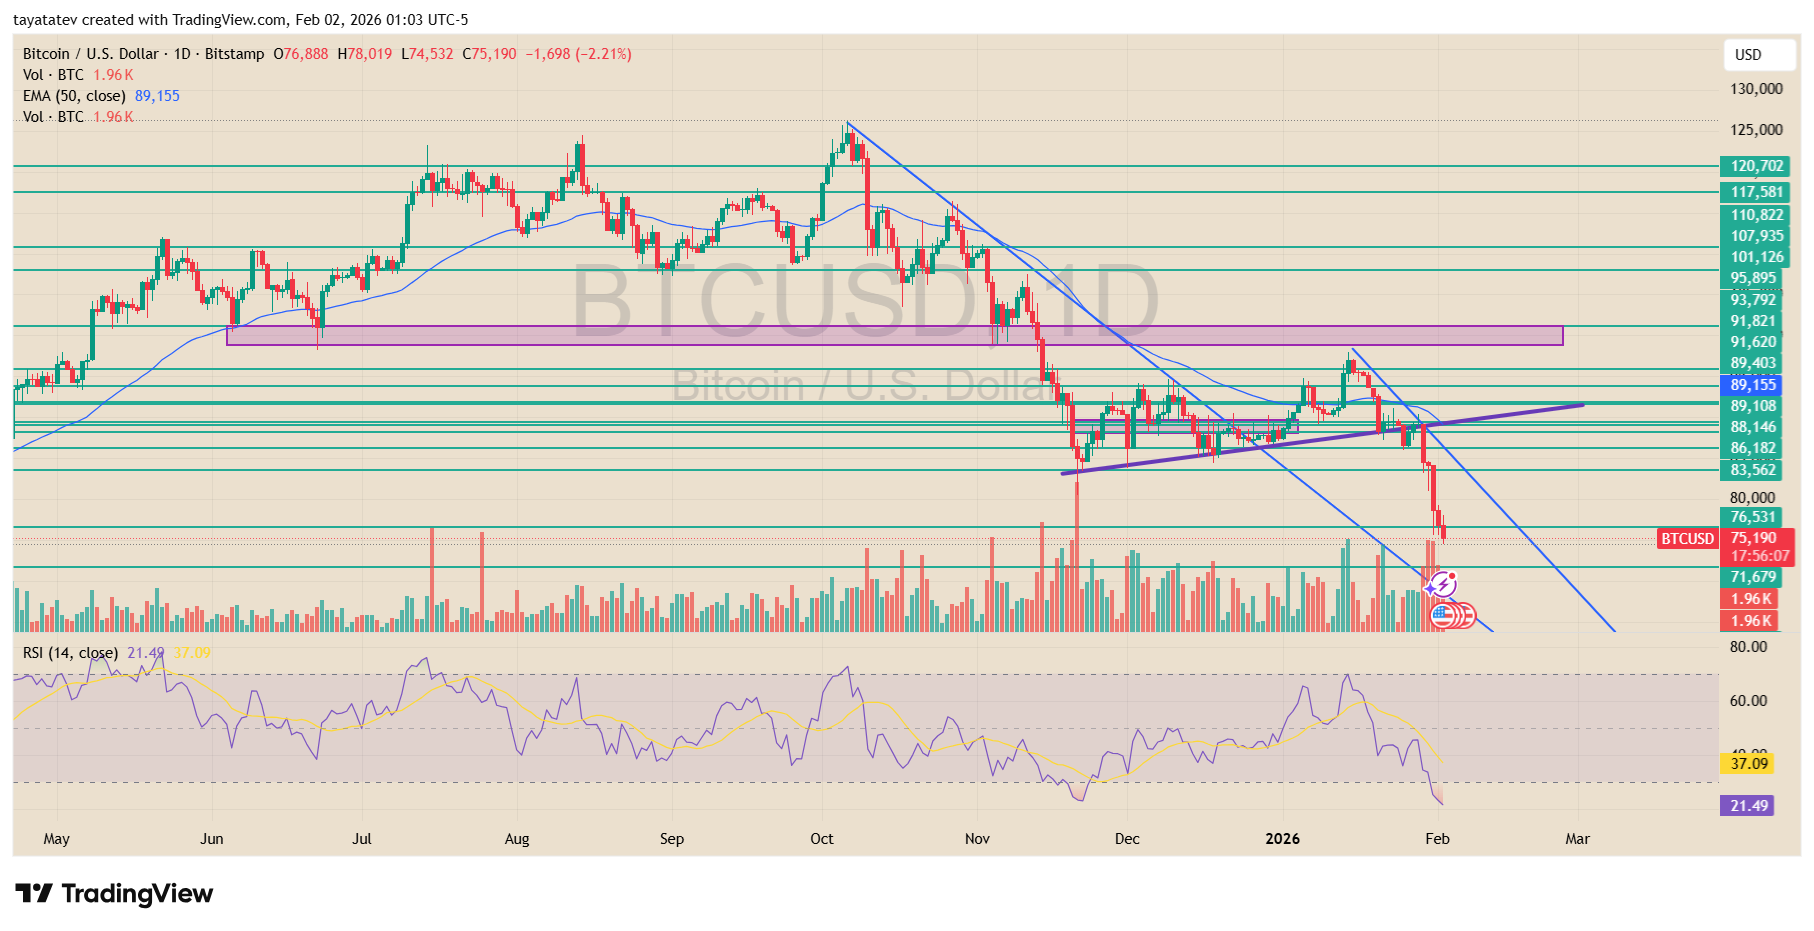
The decline unfolded steadily through Saturday and intensified on Sunday. Bitcoin first lost support near the $89,000–$88,000 area, where price had been compressing above a rising short-term trendline.
Once that structure failed, sellers pushed BTC lower in a series of long red candles. By Sunday, price sliced through the $83,500 and $80,000 levels with little pause, signaling weak demand during the weekend session.
Technically, the breakdown confirmed a continuation of the broader downtrend that began after Bitcoin failed to hold above the $90,000 region earlier in January.
Price also moved decisively below the 50-day exponential moving average, which had already turned into overhead resistance.
At the same time, volume expanded on the selloff, pointing to active distribution rather than a low-liquidity drift.
Momentum indicators reflected the speed of the move. The daily RSI slid toward the low-20s, entering deeply oversold territory as downside pressure built.
While such readings often appear near short-term exhaustion points, they also highlight how one-sided the weekend flow became, with sellers firmly in control.
By early Monday, Bitcoin was trading near $75,000, hovering just above the next visible support zone in the low-$70,000s.
The weekend drop left the market technically stretched and structurally weaker, with former support now acting as resistance if price attempts a rebound.
Bitcoin Trades Near Saylor Cost Basis as Long-Term Chart Highlights Pressure
Bitcoin traded near the mid-$75,000 area at the start of the week, sitting close to the estimated average cost basis of Michael Saylor’s long-running accumulation strategy.
The weekly Coinbase chart shows BTC pulling back from late-2025 highs above $120,000 and drifting toward a horizontal level marked as Saylor’s average entry price, after several months of lower highs.
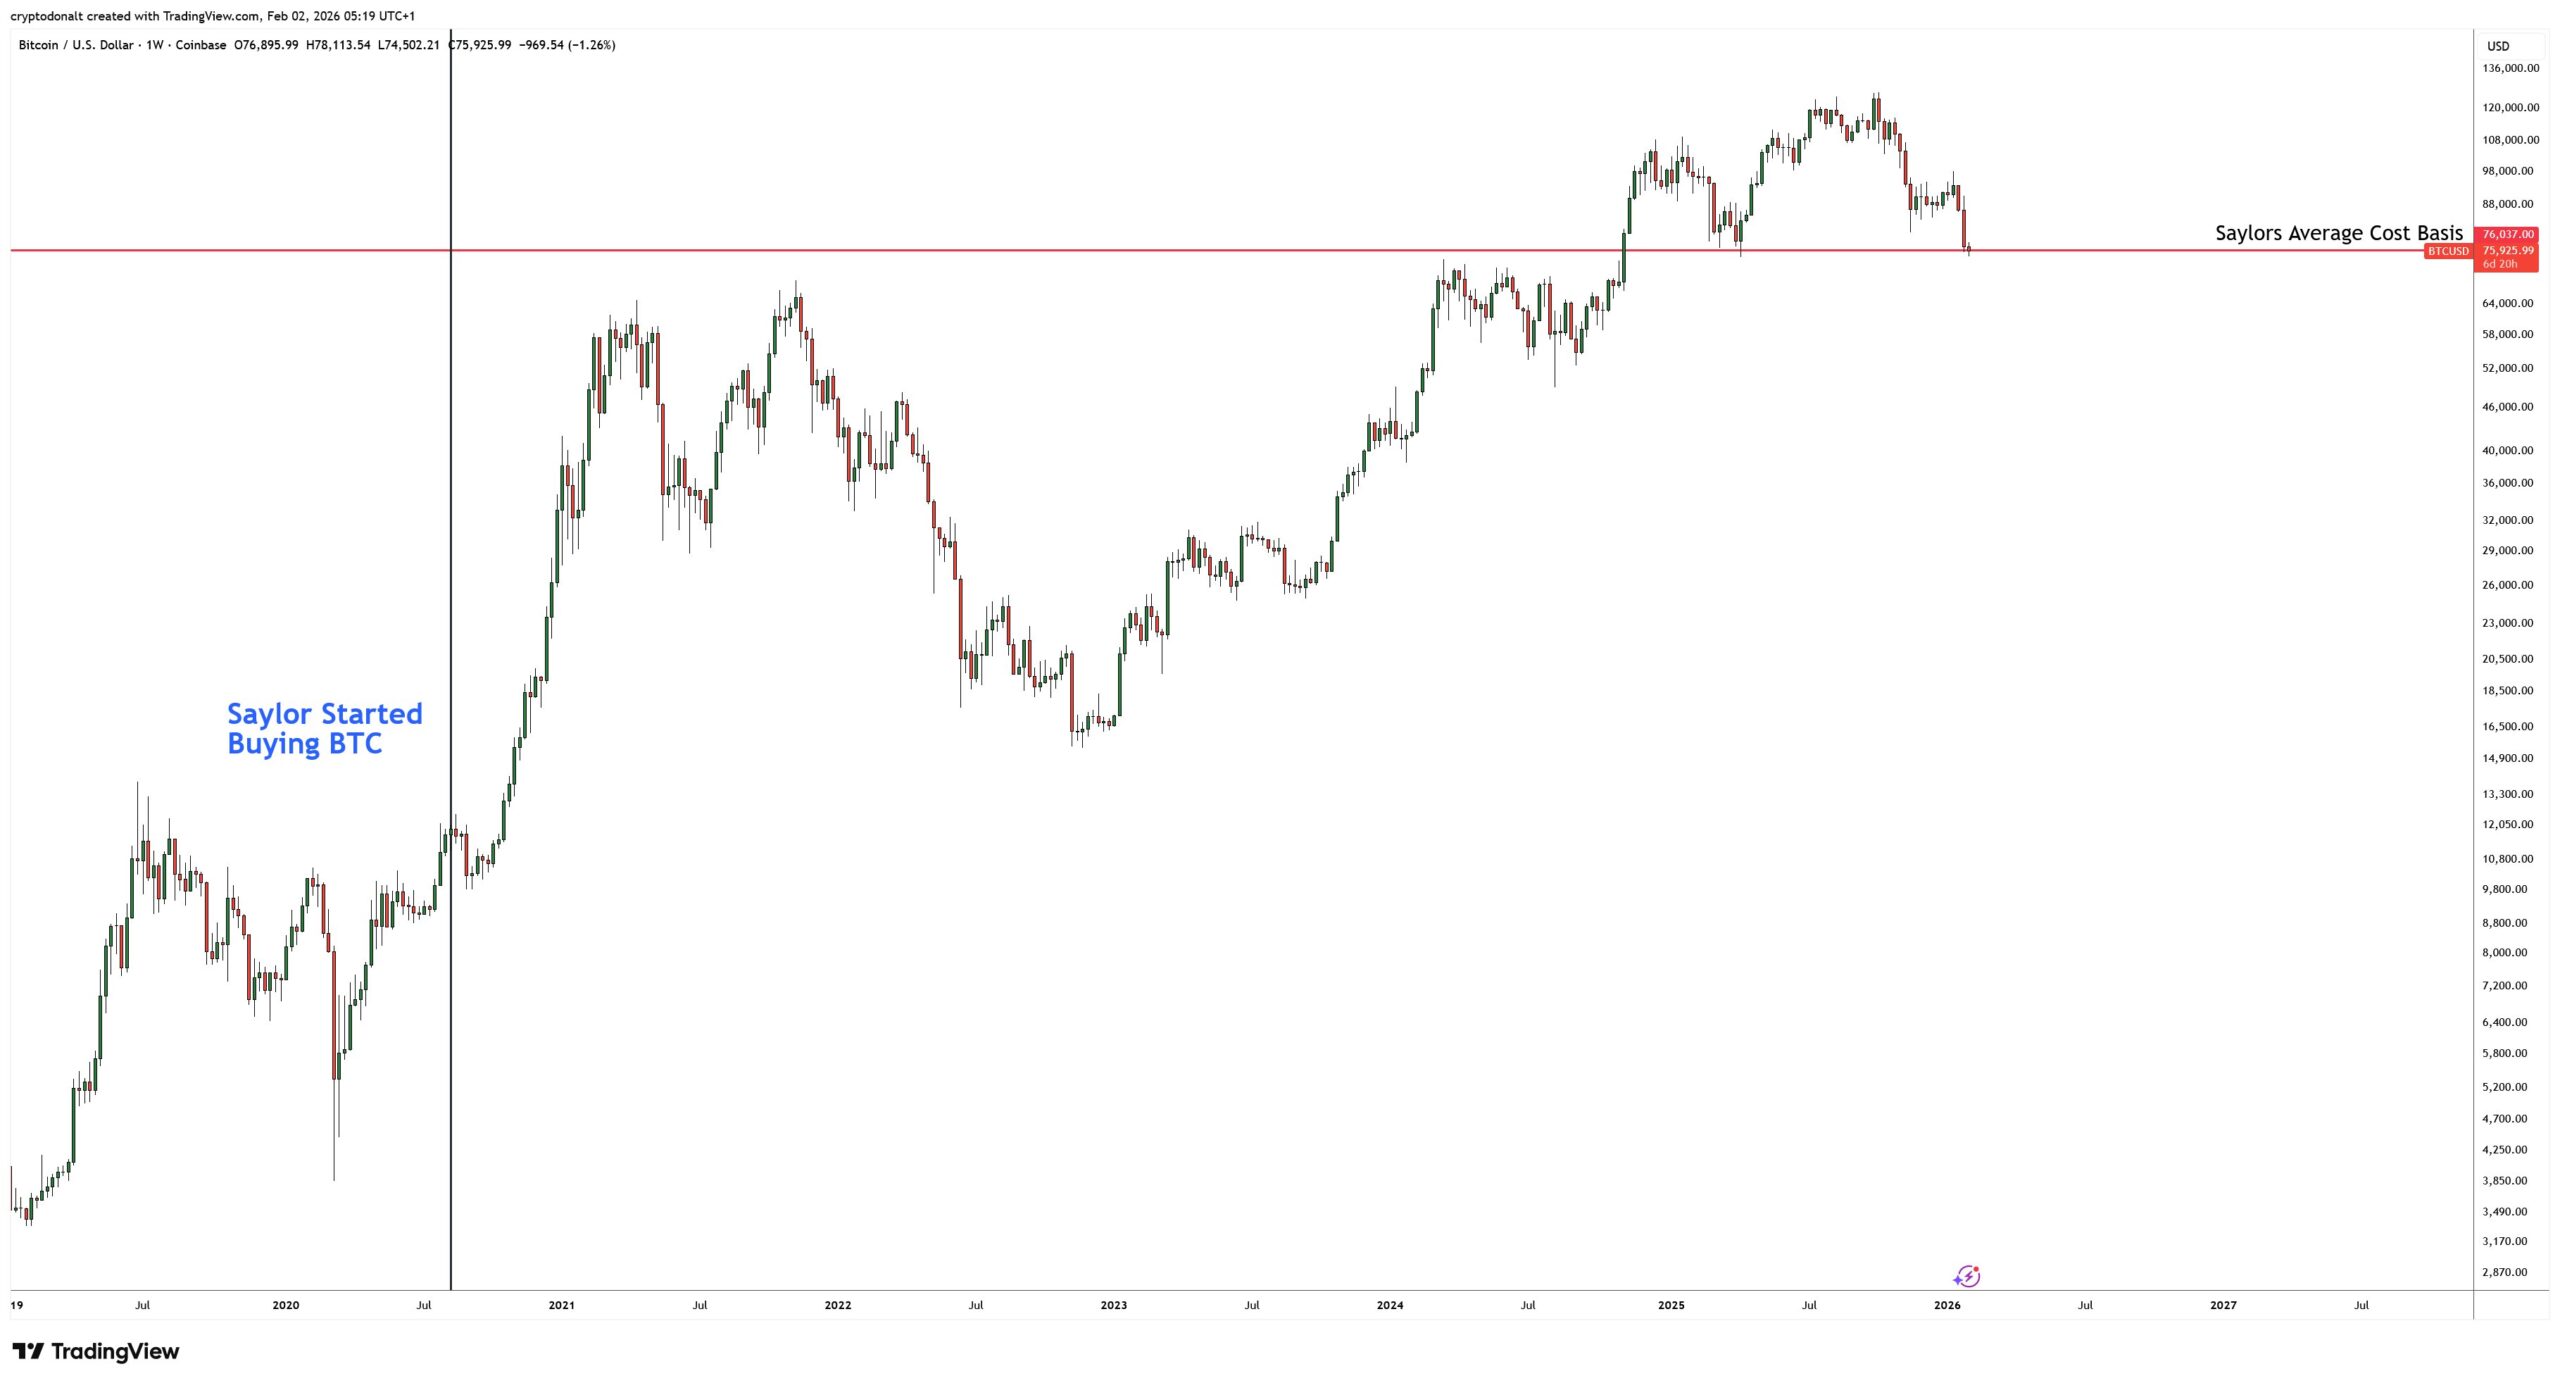
The chart places the start of Saylor’s buying activity in mid-2020, when Bitcoin traded near $11,000.
From that point, BTC entered a powerful multi-year uptrend that carried price through the 2021 cycle peak, a deep 2022 bear market, and a renewed advance into 2024 and 2025.
Throughout those swings, the cost-basis line rose gradually as additional purchases lifted the average entry price.
The latest weekly candles show Bitcoin rolling over after failing to hold above the $90,000–$100,000 range.
Selling pressure increased as price slipped below prior support, pushing BTC back toward the cost-basis zone highlighted on the chart.
As of the latest reading, Bitcoin trades slightly below that line, placing the position marginally underwater based on market price.
The visual also underscores the scale of exposure. Notes on the chart state that Saylor-related holdings account for roughly 3.5% of total Bitcoin supply, making the cost basis level a closely watched reference point during broader market drawdowns.
With price now testing that zone, the weekly structure reflects a market transitioning from expansion to consolidation, while long-term positioning remains exposed to short-term downside volatility.
Disclosure:This article does not contain investment advice or recommendations. Every investment and trading move involves risk, and readers should conduct their own research when making a decision.
Kriptoworld.com accepts no liability for any errors in the articles or for any financial loss resulting from incorrect information.

Tatevik Avetisyan is an editor at Kriptoworld who covers emerging crypto trends, blockchain innovation, and altcoin developments. She is passionate about breaking down complex stories for a global audience and making digital finance more accessible.
📅 Published: February 2, 2026 • 🕓 Last updated: February 2, 2026
