


Cardano (ADA) rebounded from a long-running support zone this week, as traders pointed to a possible bullish setup forming on the daily chart.
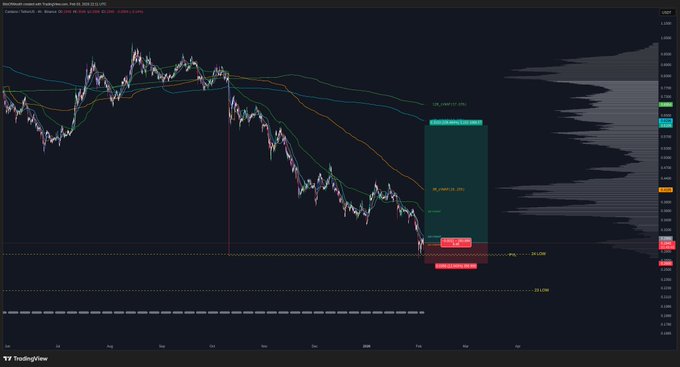
A TradingView chart shared by analyst Bitsofwealth on X showed ADA holding a horizontal demand area after a multi-month downtrend.
Price had trended lower since late 2025, with successive lower highs capped by declining moving averages.
However, the latest bounce developed near a high-volume node on the volume profile, where past trading activity has clustered.
That zone has acted as a reaction point several times during the broader decline, suggesting active participation by buyers and sellers at similar levels.
The chart also marked a potential long setup with defined risk below the recent swing low and upside targets mapped toward prior resistance bands overhead.
If price sustains above the current base, the next technical hurdles sit near the descending moving averages and the former consolidation range that capped rebounds during the downtrend.
At the time of the snapshot, ADA traded near local lows after printing a series of small-bodied candles, signaling slowing downside momentum as price compressed near support.
Stay ahead in the crypto world – follow us on X for the latest updates, insights, and trends!🚀
Bullish flag puts Cardano at a make or break level
A weekly Cardano to U.S. dollar chart on Coinbase showed price trading inside a downward sloping channel that technicians often label a bullish flag after a sharp prior rally.
The pattern formed after ADA surged into early 2025, then began consolidating lower between two parallel trendlines.
Meanwhile, the latest candles sat near the lower boundary of that channel, which marks the key support area that keeps the flag structure intact.
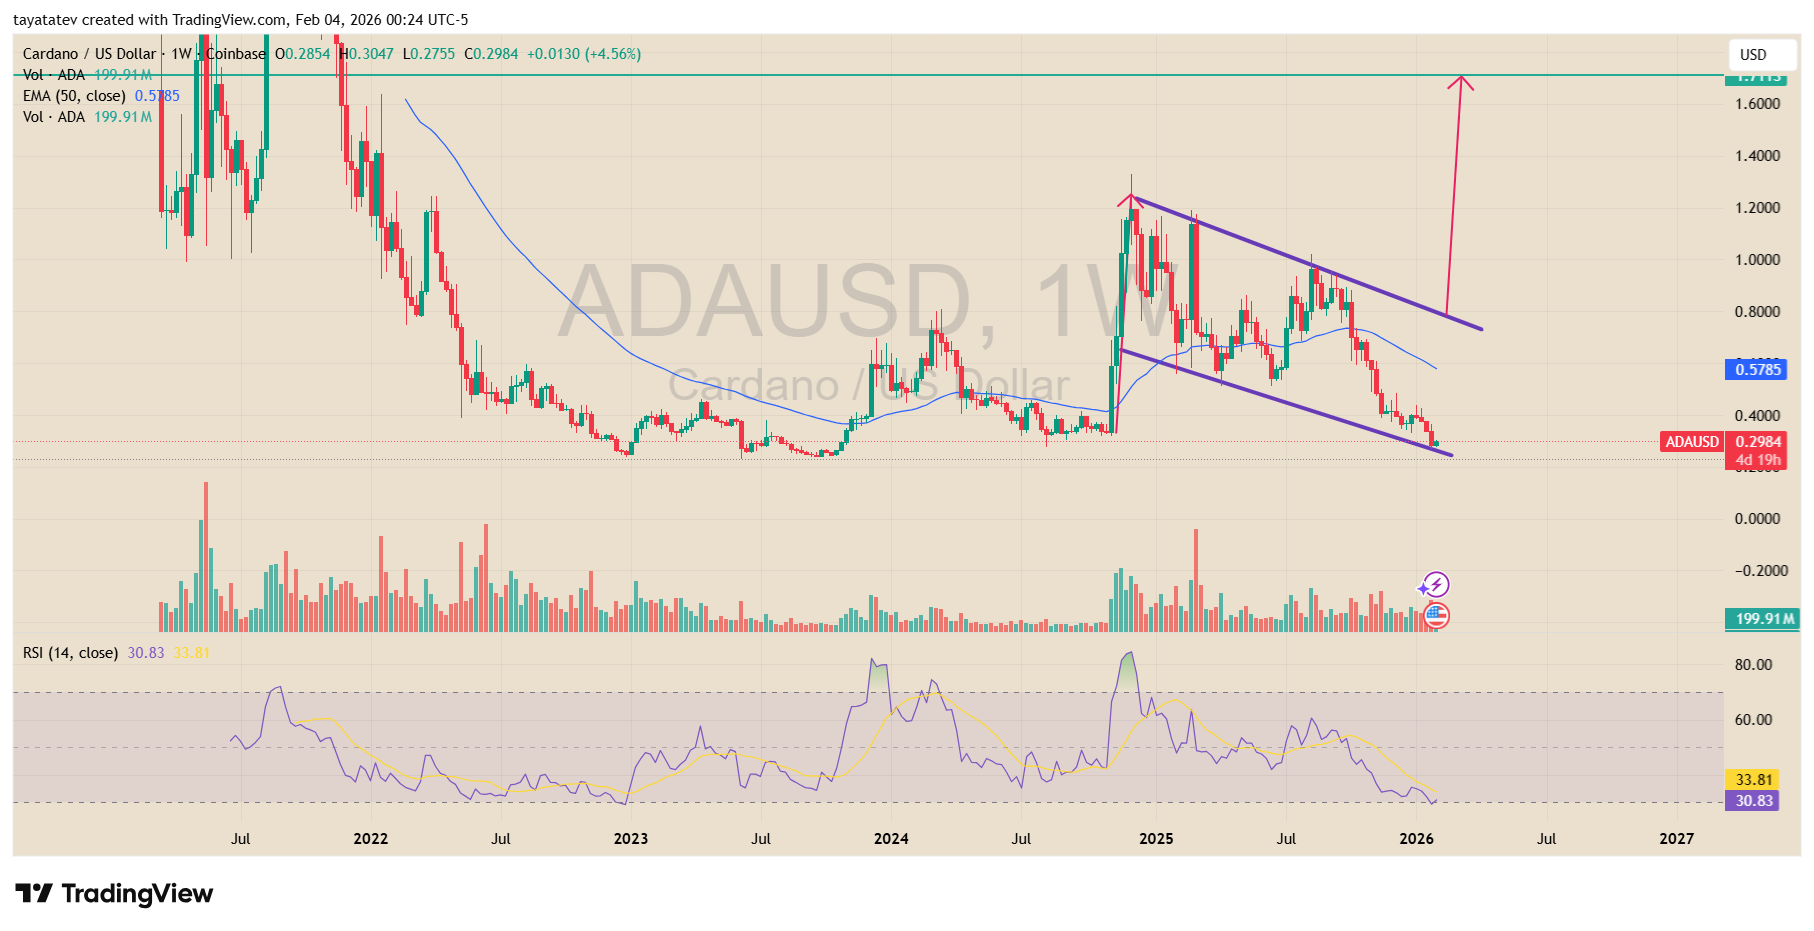
At the time of the snapshot, ADA traded near $0.298, while the 50 week exponential moving average sat much higher, near $0.579.
That gap kept overhead pressure in place and also defined the first major level bulls would need to reclaim on any rebound.
In addition, the relative strength index read near 31, which signaled weak momentum as price pressed into the bottom of the formation.
If ADA drops cleanly below the lower flag line and fails to recover it, the move would weaken the bullish flag read because price would leave the channel to the downside.
In that case, traders typically treat the pattern as invalid and then look for the market to search for the next demand zone below the broken support.
If ADA holds the lower boundary and then breaks out above the upper flag line, the chart implies a potential measured move higher based on the size of the prior upswing that preceded the flag.
Under that approach, some traders would map a target that sits roughly 465% above the current price area, which would place the projection around the $1.65 to $1.70 region from roughly $0.30, depending on the exact breakout point and method used.
Disclosure:This article does not contain investment advice or recommendations. Every investment and trading move involves risk, and readers should conduct their own research when making a decision.
Kriptoworld.com accepts no liability for any errors in the articles or for any financial loss resulting from incorrect information.

Tatevik Avetisyan is an editor at Kriptoworld who covers emerging crypto trends, blockchain innovation, and altcoin developments. She is passionate about breaking down complex stories for a global audience and making digital finance more accessible.
📅 Published: February 4, 2026 • 🕓 Last updated: February 4, 2026
