


Cardano traded near $0.357 on the weekly ADAUSD chart from TradingView, and the drawing on the chart frames the recent slide as a bullish flag that could set up a rebound if price breaks out.
ADA bullish flag setup and what would confirm it
A bullish flag is a two step pattern. First, price makes a sharp move up, often called the “flagpole.” Then, it cools off inside a tight, downward sloping channel.
Traders watch for a breakout above the channel because that break can signal the prior uptrend is trying to resume.
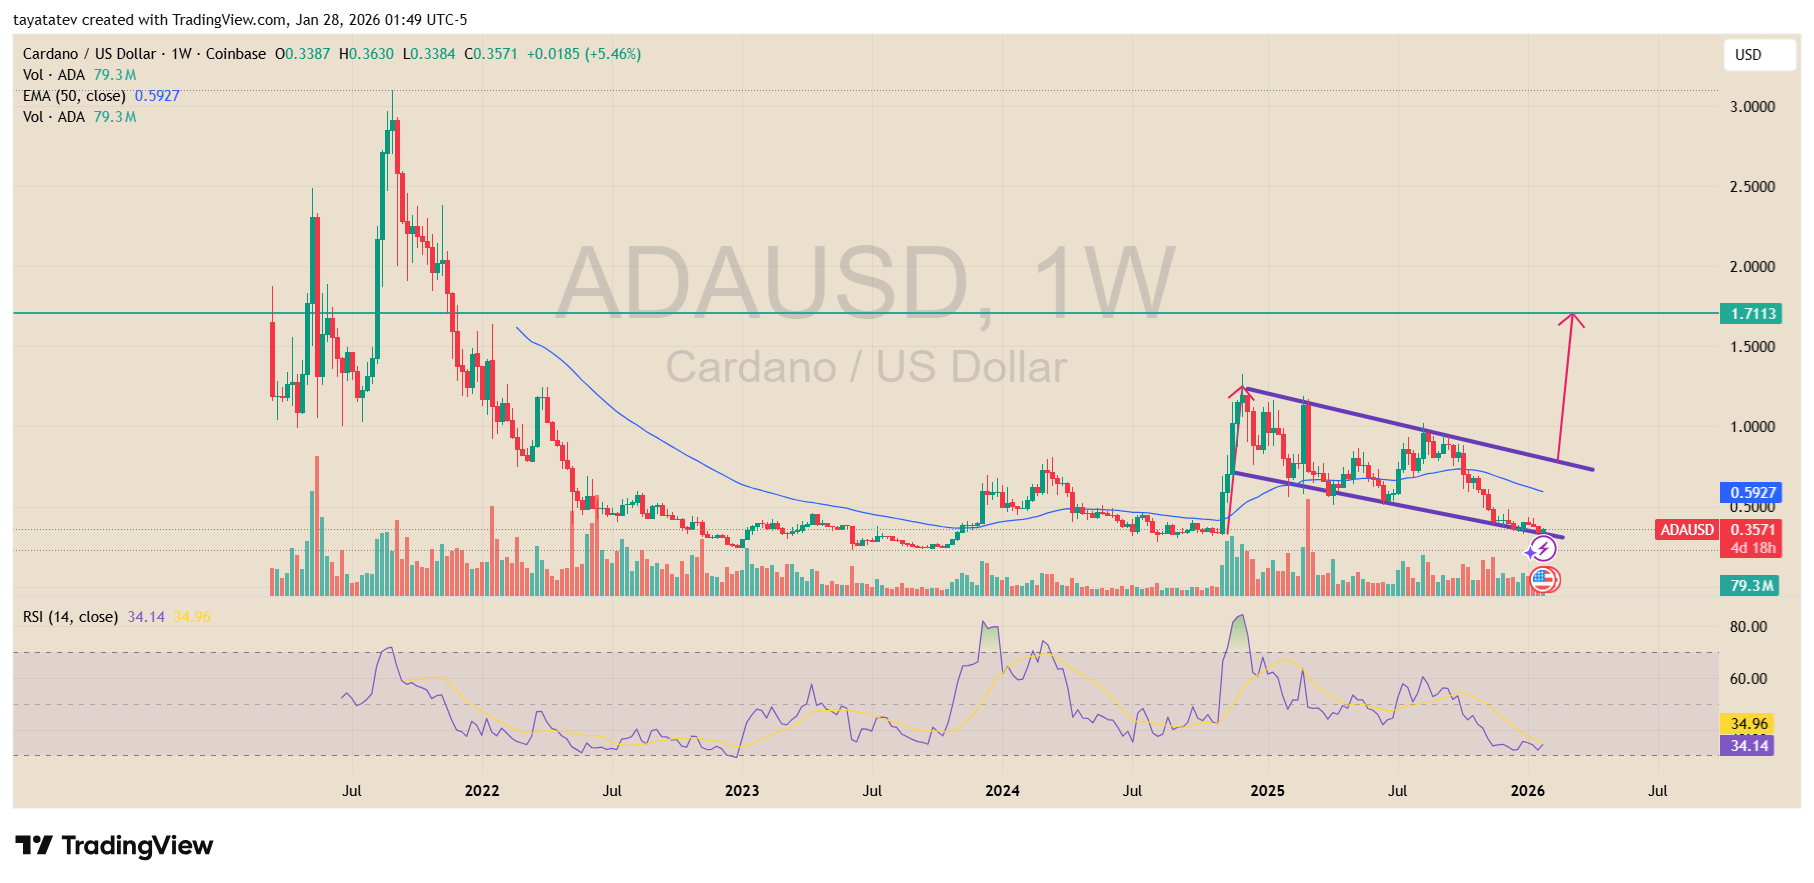
On this chart, the “flag” is the purple, falling channel that formed after a strong upswing in late 2024 and early 2025.
Price has drifted lower inside that channel and is now pressing near the lower boundary, while the 50 week EMA sits higher near $0.5927, showing ADA remains below a key trend level.
The chart’s upside projection points toward $1.7113. If ADA confirms the bullish flag with a clean breakout and weekly hold above the upper trendline, the measured move idea implies a large upside extension.
From the current $0.357, a 385% rise would place ADA near $1.73, which is close to the chart’s $1.7113 target line.
Confirmation still matters. A breakout attempt that fails and drops back into the channel can invalidate the flag setup.
Momentum also looks soft on this snapshot, with RSI near 34, which shows weak strength on the weekly time frame even as it sits near levels traders often associate with oversold conditions.
ADA holds near long term demand zone as analyst flags possible reversal
Cardano traded around $0.34 against Tether on the weekly ADAUSDT Binance chart, with the latest candle showing a drop from about $0.3757 to $0.3402.
The chart marks a wide support band that has repeatedly attracted bids, highlighted by two prior reactions inside the same demand area.
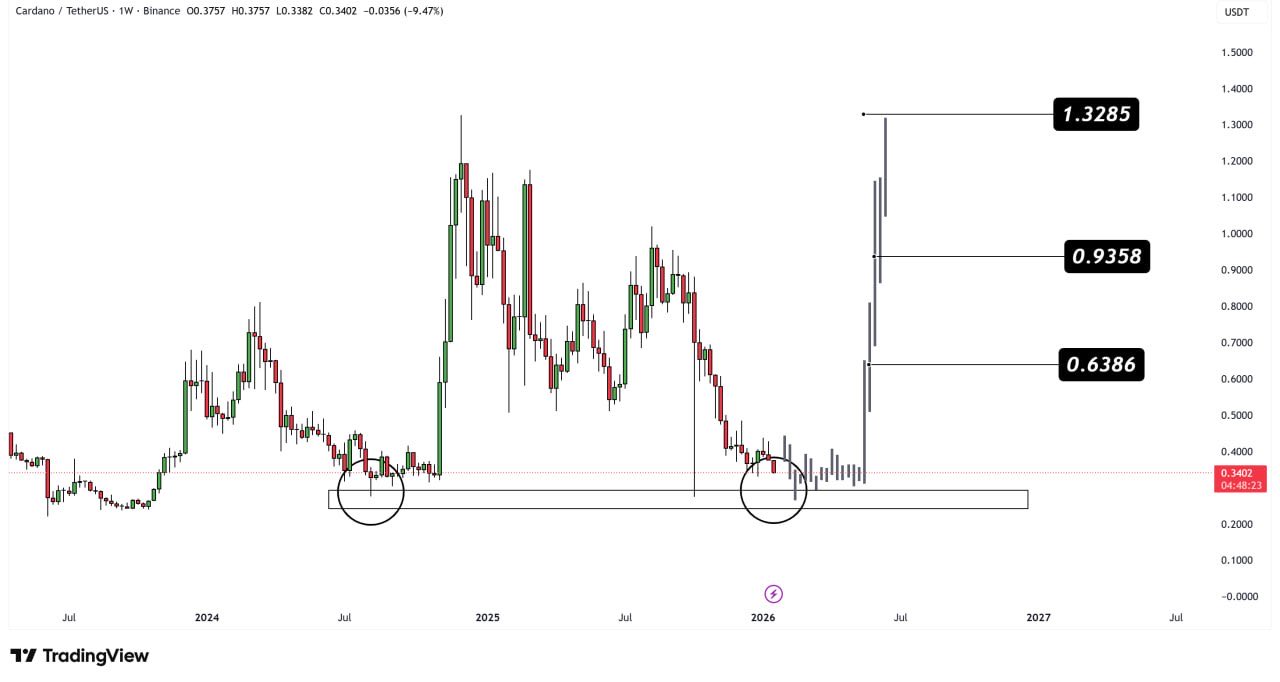
In an X post, Rose Premium Signals said the zone reflects “strong long term support” and described recent price action as consolidation with accumulation behavior.
The post added that repeated reactions from the band can raise the odds of a bullish reversal once momentum returns.
The chart also shows upside reference levels above current price, labeled near $0.6386, $0.9358, and $1.3285, which the analyst uses as potential targets if ADA rebounds from the support area.
Disclosure:This article does not contain investment advice or recommendations. Every investment and trading move involves risk, and readers should conduct their own research when making a decision.
Kriptoworld.com accepts no liability for any errors in the articles or for any financial loss resulting from incorrect information.

Tatevik Avetisyan is an editor at Kriptoworld who covers emerging crypto trends, blockchain innovation, and altcoin developments. She is passionate about breaking down complex stories for a global audience and making digital finance more accessible.
📅 Published: January 28, 2026 • 🕓 Last updated: January 28, 2026
