


Ripple’s XRP drew fresh attention on X after analyst Austin posted a long-term TradingView chart showing a multi-year compression pattern that resolved into a sharp move.
In his post, Austin wrote, “Few charts tell a story this clearly,” alongside “$XRP.”
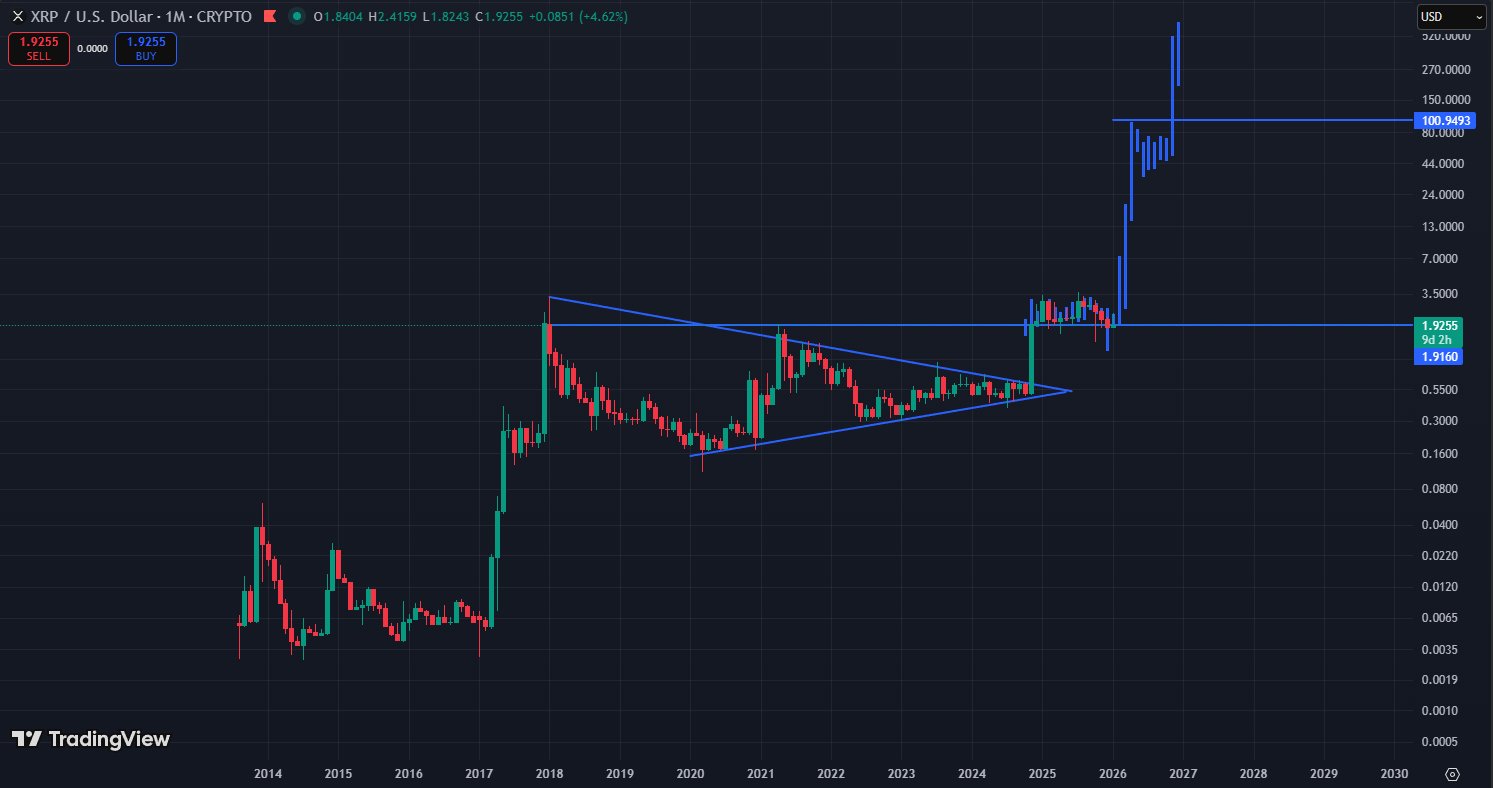
The image shows the XRP U.S. Dollar pair on a monthly timeframe, with trendlines outlining a symmetrical triangle that formed after earlier cycle peaks.
The triangle’s upper boundary slopes down from the 2018 high area, while the lower boundary slopes up from subsequent lows, tightening into the 2023–2024 window.
After price action narrowed toward the triangle’s apex, the chart shows a breakout and a fast expansion in range.
A horizontal level sits near $1.9160, and the current readout on the chart shows XRP around $1.9255 at the captured moment.
The same chart includes a higher horizontal marker labeled near $100.9493 and a cluster of tall monthly candles above it.
Those markings reflect the author’s technical framing on the screenshot rather than an exchange statement or official price target.
TradingView’s layout and Austin’s caption framed the post as a clean, long-term technical “story,” centered on how XRP moved from years of consolidation into a high-volatility phase.
XRP chart shows long consolidation and projected Fibonacci levels
XRP gained renewed focus on X after analyst Maxi shared a long-term TradingView chart outlining what he described as a multi-year rounded bottom and cup-and-handle formation.
In the post, Maxi said XRP has spent roughly a year consolidating below its previous all-time high resistance, framing the structure as a potential swing-trade setup rather than a short-term move.
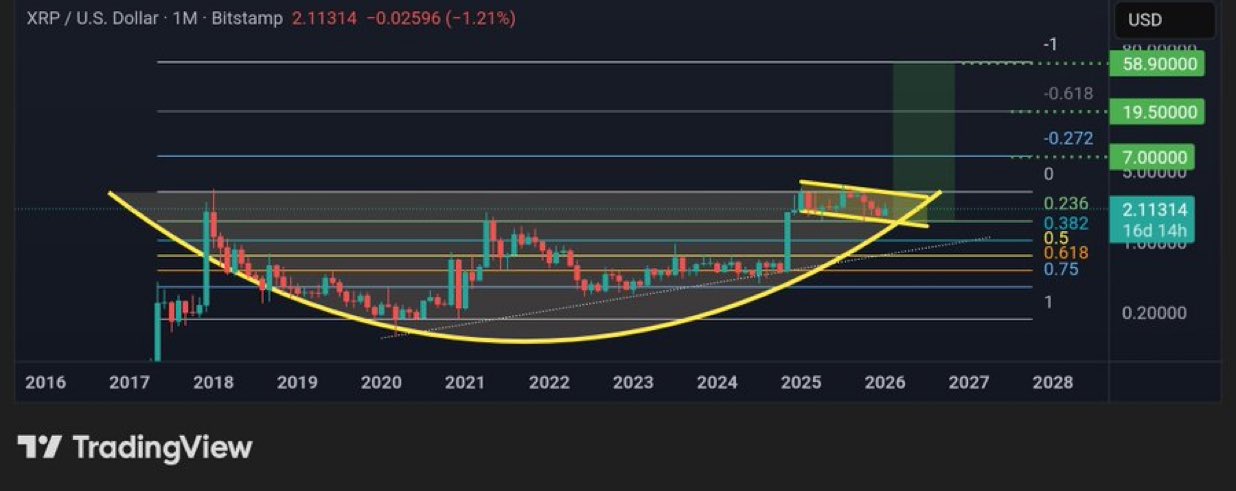
The chart displays the XRP U.S. Dollar pair on a monthly timeframe from Bitstamp, stretching back to 2016.
A broad curved base highlights what Maxi labeled an “~8 year rounded bottom,” followed by a handle-like consolidation beneath earlier cycle highs. Price appears to compress near the upper range as the pattern matures.
Fibonacci levels are drawn across the chart, with price currently trading around $2.11 at the time of capture. Horizontal bands mark several extensions above the current range.
Maxi identified three upside levels tied to this structure, pointing to $7.0, $19.5, and $58.9 as potential targets based on the measured move and Fibonacci projections.
In his commentary, Maxi stressed that the $58.9 level represents his highest technical target and distinguished it from earlier speculative figures often cited in XRP discussions.
The post framed the setup as a longer-term swing trade idea derived from historical price structure, not as a near-term forecast.
Disclosure:This article does not contain investment advice or recommendations. Every investment and trading move involves risk, and readers should conduct their own research when making a decision.
Kriptoworld.com accepts no liability for any errors in the articles or for any financial loss resulting from incorrect information.

Tatevik Avetisyan is an editor at Kriptoworld who covers emerging crypto trends, blockchain innovation, and altcoin developments. She is passionate about breaking down complex stories for a global audience and making digital finance more accessible.
📅 Published: January 23, 2026 • 🕓 Last updated: January 23, 2026
