


Bitcoin stayed under pressure on the daily chart after price broke below a rising support line and extended its broader downtrend structure.
The BTCUSD pair traded near the low $70,000 area on Bitstamp on Feb. 5, following a sharp selloff that accelerated through multiple former support zones.
Stay ahead in the crypto world – follow us on X for the latest updates, insights, and trends!🚀
As a result, price now sits well below the 50 day exponential moving average, which has turned into overhead resistance during the decline.
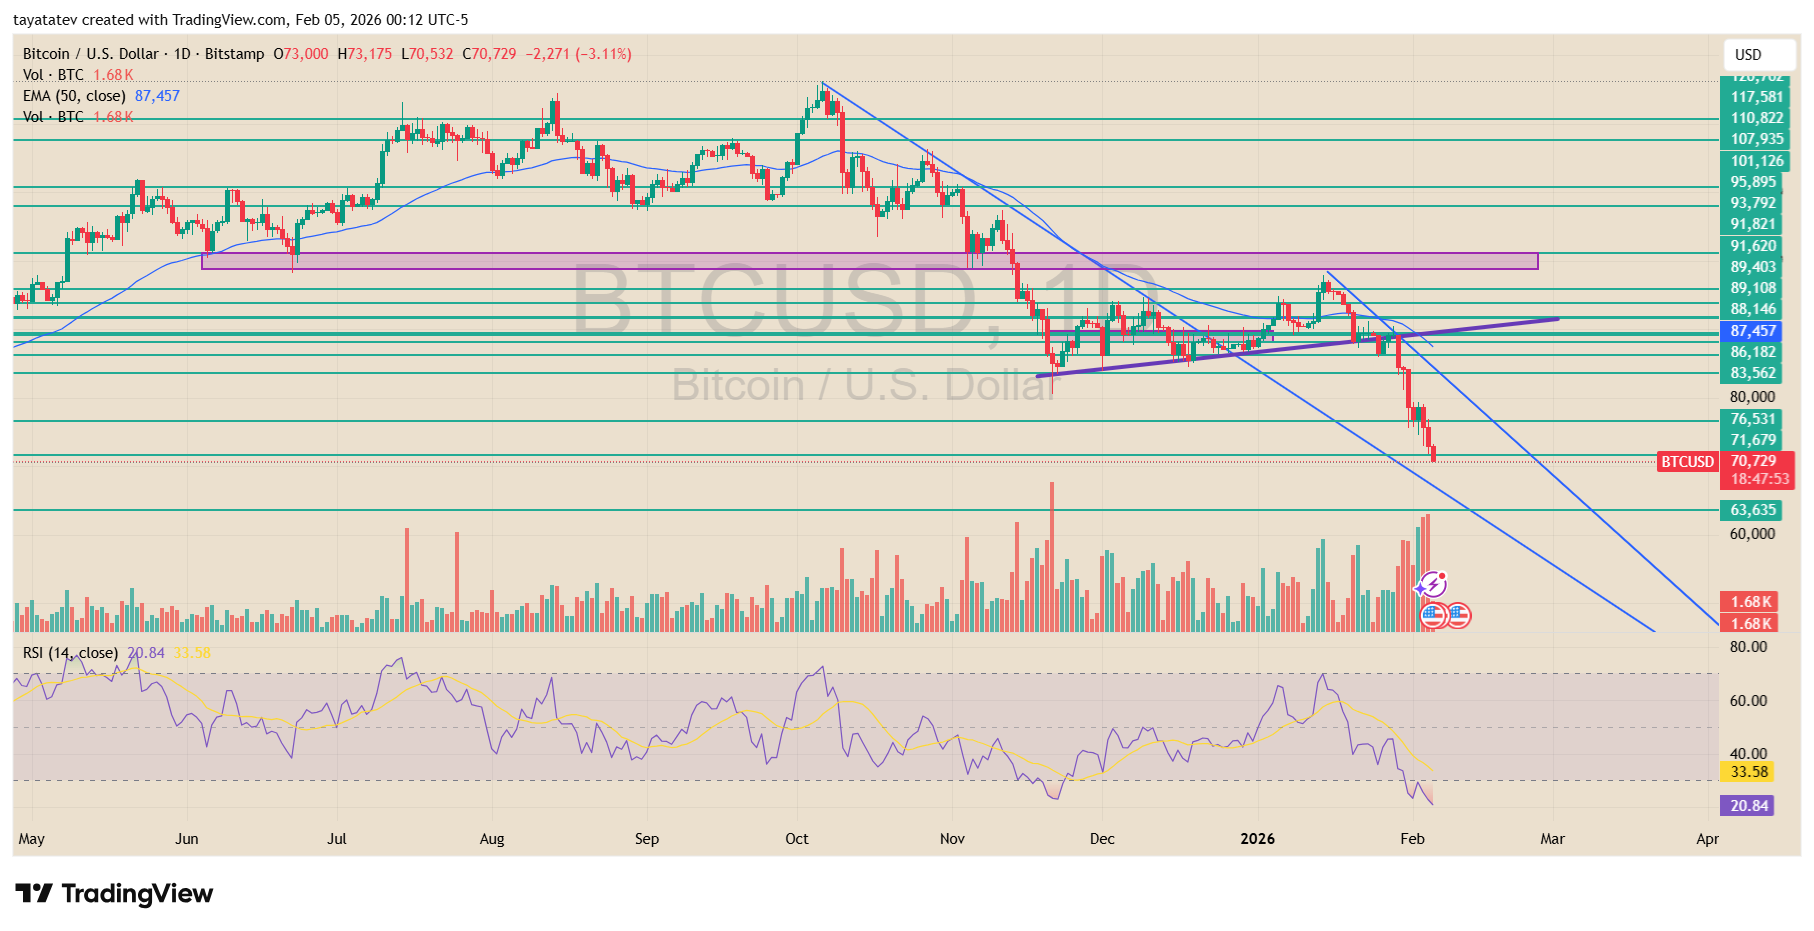
Earlier, Bitcoin failed to hold a multi month support band near the mid $80,000s. That zone had capped several rebounds in December and January before price rolled over.
After that breakdown, sellers pushed BTC through a short term consolidation range that had formed above the low $80,000s.
Consequently, each rebound attempt since November has stalled below descending trend resistance, which continues to guide lower highs on the daily structure.
In addition, the chart shows a clear descending channel that has contained price since the late October peak. Bitcoin respected the upper boundary of that channel during recent bounce attempts, then turned lower again.
This repeated rejection confirms that sellers remain in control of the prevailing trend. At the same time, former demand levels near the mid $80,000s and upper $80,000s now act as layered resistance after flipping from support.
Moreover, volume expanded during the latest breakdown, which points to stronger participation during the move lower.
The selloff followed a failed attempt to reclaim the 50 day EMA, reinforcing the pattern of price losing ground each time it tests trend resistance.
Therefore, the moving average continues to slope downward and pressure price from above.
Momentum indicators also reflect persistent downside pressure. The daily RSI slid toward the low 20s, which shows heavy selling strength rather than stabilization.
Although brief bounces have appeared during prior dips, momentum has failed to build higher lows. Instead, each recovery attempt has faded as RSI rolled over below the midline, which aligns with the ongoing downtrend structure.
Finally, the broader structure remains bearish because Bitcoin continues to print lower highs and lower lows on the daily timeframe.
The break below the rising support line that guided price through December removed the last visible bullish prop in the short term structure.
As long as BTC trades below descending trend resistance and below the 50 day EMA, the downtrend remains intact and price action reflects sustained selling pressure rather than trend repair.
Bitcoin Extends Downtrend as 3 Day Chart Breaks Key Support
Bitcoin remained in a downtrend on the three day chart after price broke below the $77,086 level flagged on TradingView by market analyst Ali Charts.
The breakdown followed a series of lower highs since the late 2025 peak, which confirmed sustained downside control on the higher time frame.
As a result, the broader structure continues to point lower after price failed to hold the prior range floor.
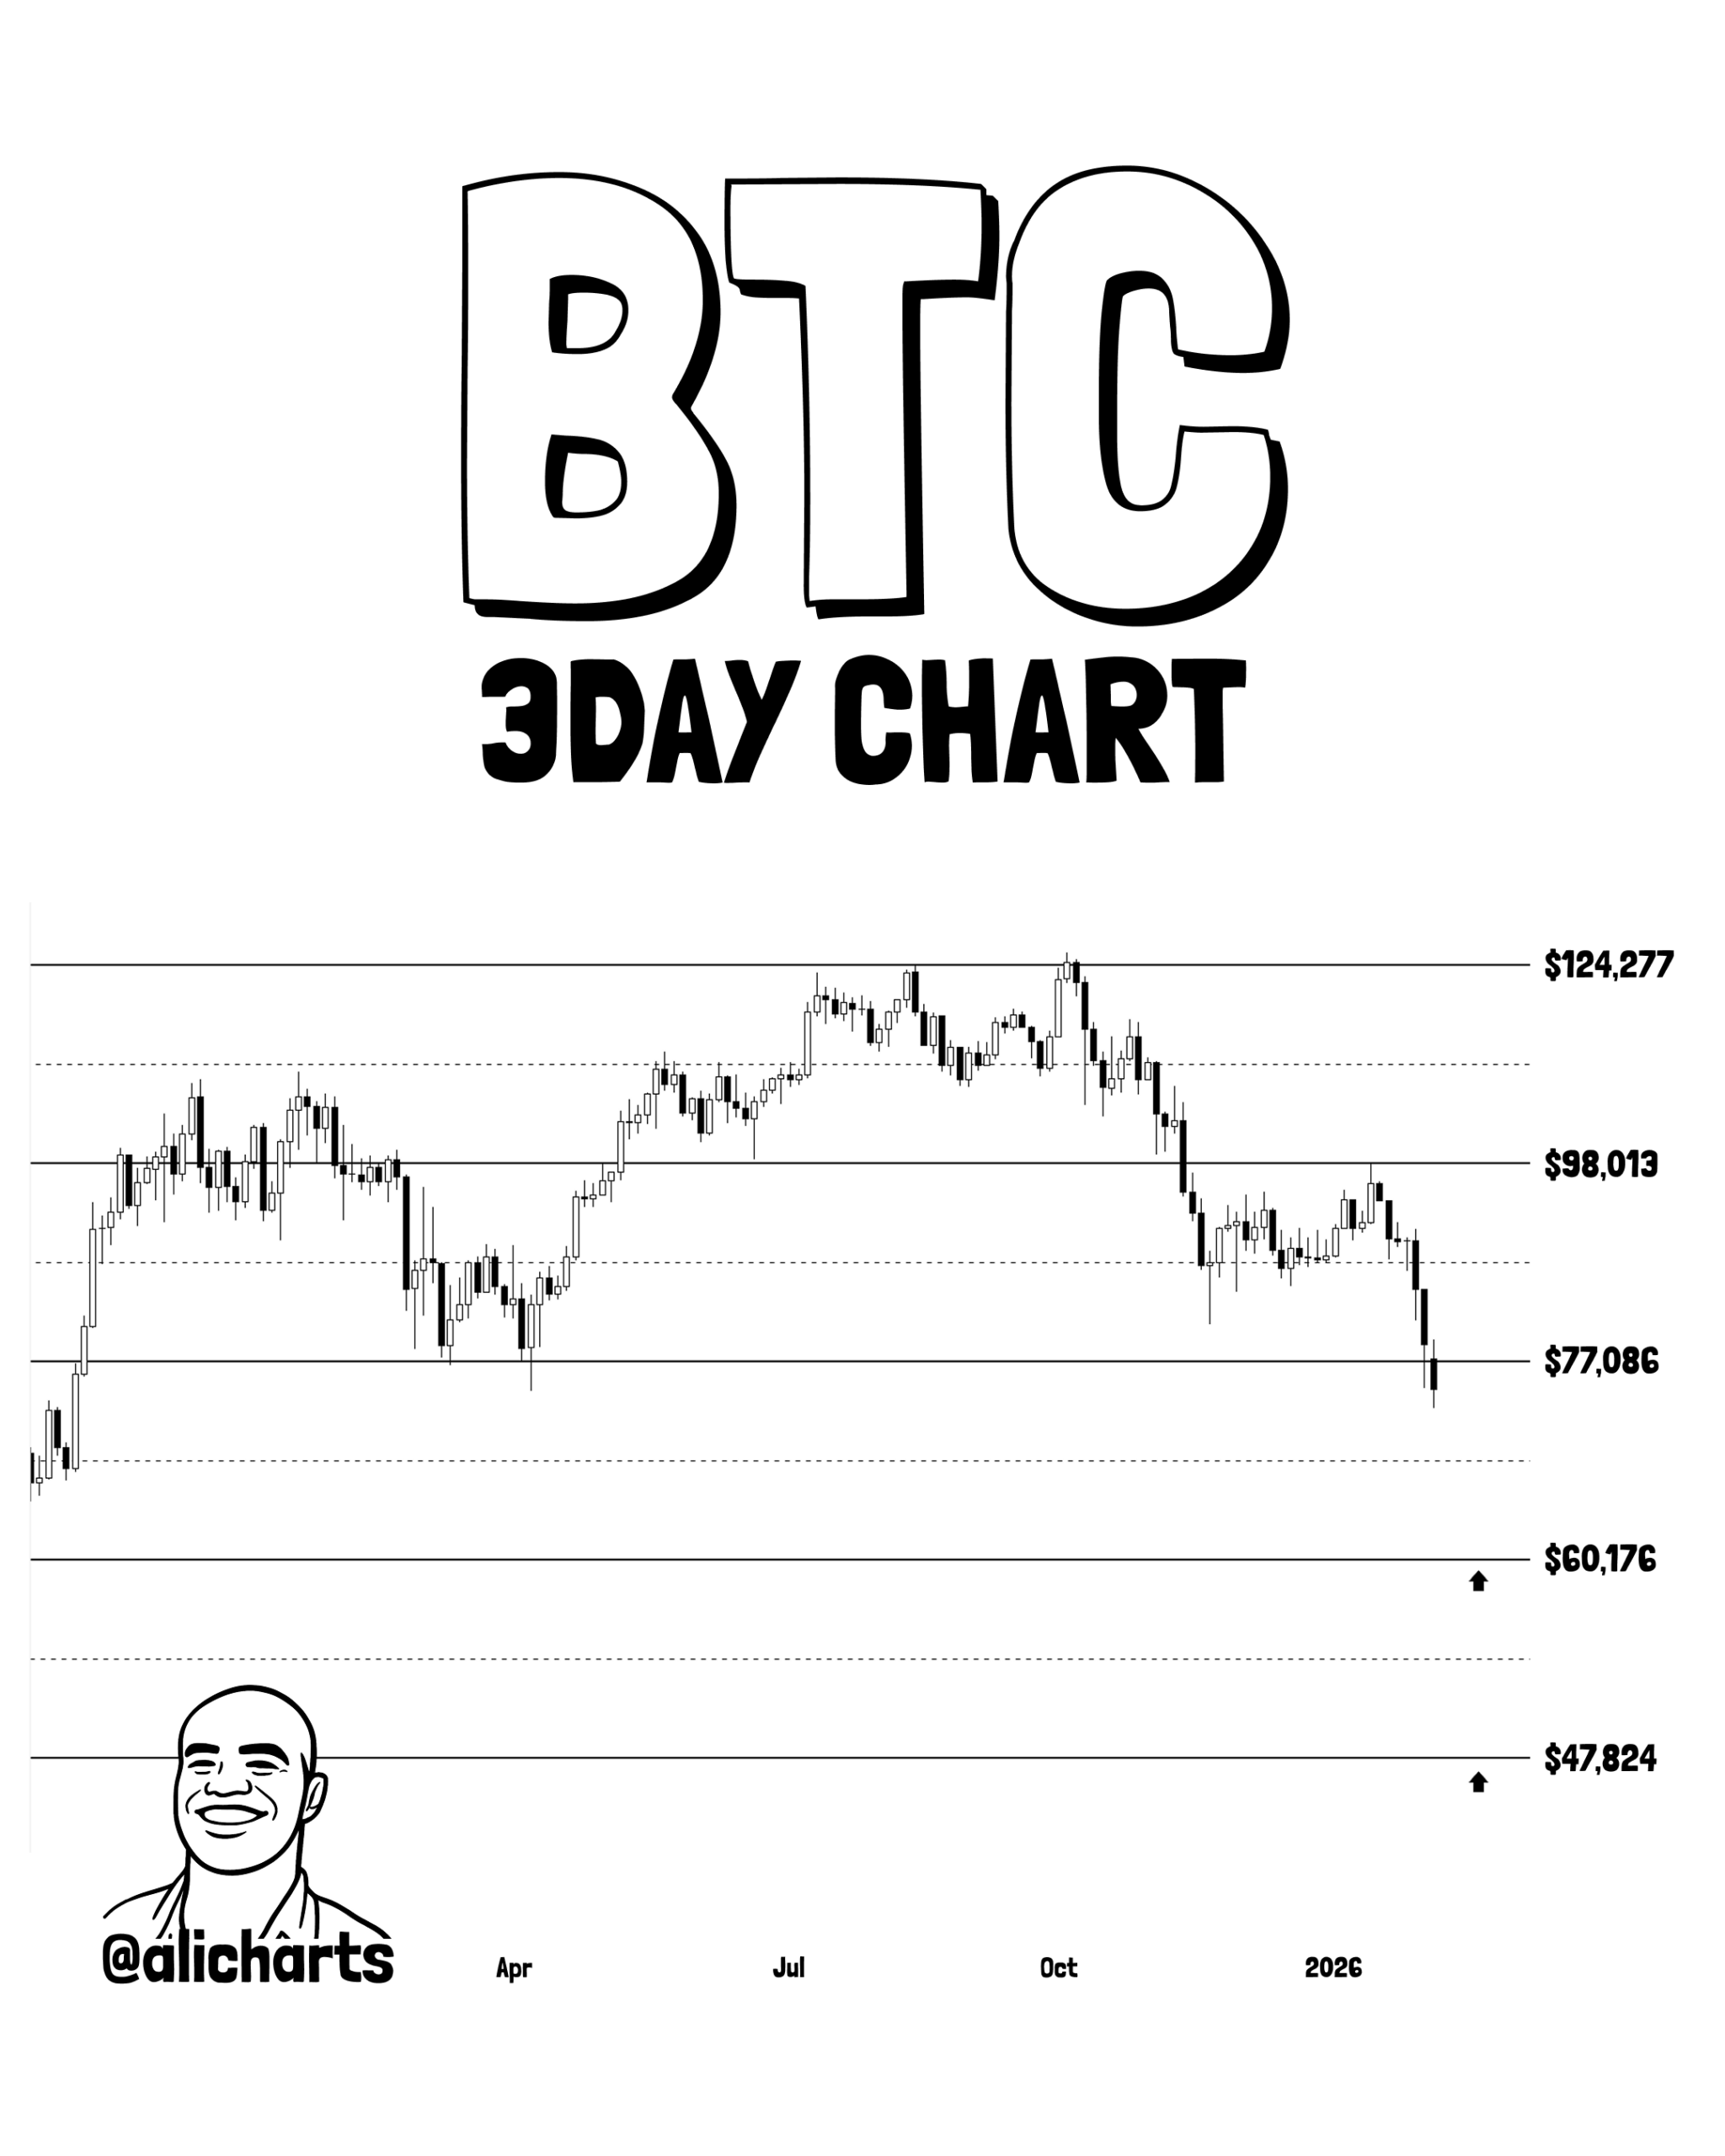
Earlier, Bitcoin rolled over from the upper resistance band near the $124,277 area, where repeated rejections capped the last major advance.
After that peak, price formed a distribution phase near the $98,013 zone before sellers forced a decisive break lower. That level now acts as overhead resistance after flipping from support, which limits rebound attempts during the current leg down.
Moreover, the three day structure shows a clean sequence of lower highs and lower lows, which defines the prevailing downtrend on this timeframe.
Each recovery attempt since October stalled beneath former support, and each breakdown expanded the downside range. Consequently, the market structure reflects continuation pressure rather than base building.
In addition, the latest move pushed price into a new lower range after the loss of $77,086, which had served as a key reaction zone during earlier pullbacks.
With that level broken, the next visible reference areas on the chart sit near $60,176 and $47,824, which marked prior reaction zones during earlier phases of the broader cycle.
These levels now stand as the next major downside references on the three day structure.
Finally, the failure to reclaim former range support keeps the trend biased lower on the higher time frame.
Until price repairs structure above the broken $77,086 zone and then clears the lower high sequence beneath the $98,013 area, the three day trend remains in a downtrend and price action reflects sustained selling pressure.
Disclosure:This article does not contain investment advice or recommendations. Every investment and trading move involves risk, and readers should conduct their own research when making a decision.
Kriptoworld.com accepts no liability for any errors in the articles or for any financial loss resulting from incorrect information.

Tatevik Avetisyan is an editor at Kriptoworld who covers emerging crypto trends, blockchain innovation, and altcoin developments. She is passionate about breaking down complex stories for a global audience and making digital finance more accessible.
📅 Published: February 5, 2026 • 🕓 Last updated: February 5, 2026
