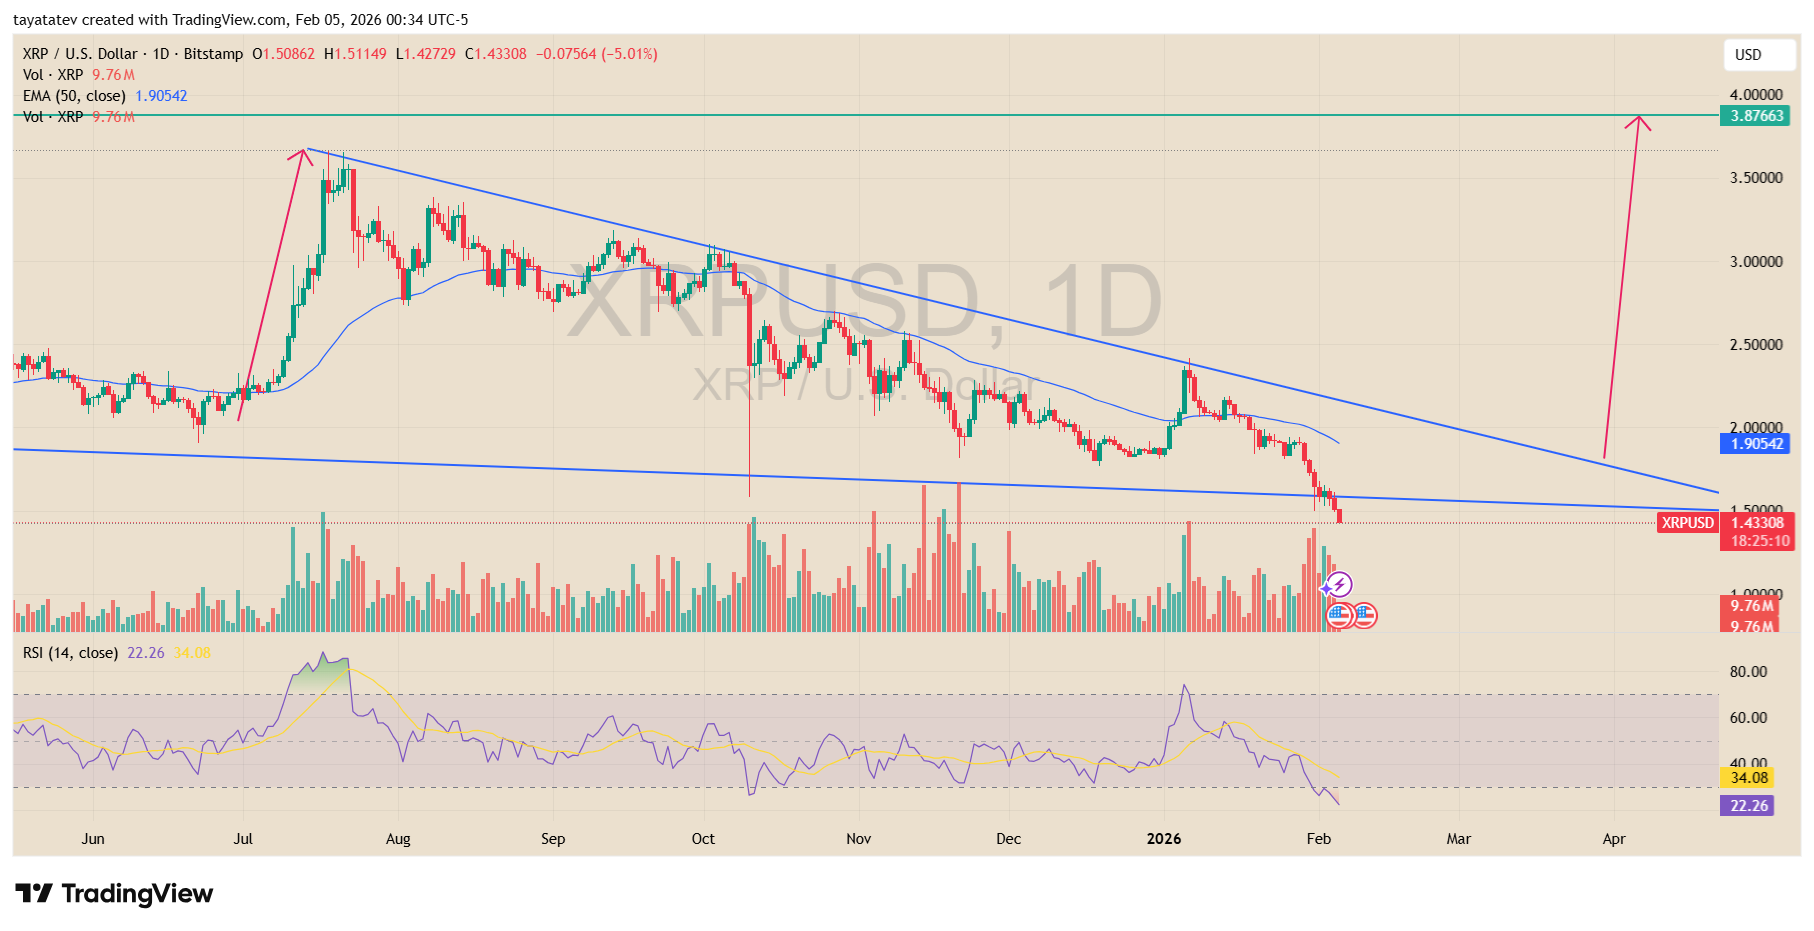
I created this falling wedge using the recent swing highs and lows. The setup places XRP near the lower boundary of the structure, with price pressing into a long-term support zone.
XRP U.S. Dollar Daily Chart. Source: TradingView
A falling wedge forms when sellers push price lower, yet downside momentum slows as the range tightens. As a result, the pattern often appears during extended downtrends.
However, the structure alone does not confirm a reversal. Instead, the setup stays valid while price holds inside the wedge.
At this stage, XRP remains in a safe zone within the pattern, since price has not broken the structure or reclaimed key resistance.
For a reversal setup to come into view, XRP must break above the upper blue trendline that defines wedge resistance.
Until that happens, the broader downtrend structure stays intact. The daily close also remains below the 50-day EMA, which now acts as overhead resistance. Therefore, the chart still reflects downside pressure.
A clean break and hold above the blue resistance line would shift structure and allow the chart to move from compression toward a potential trend change.
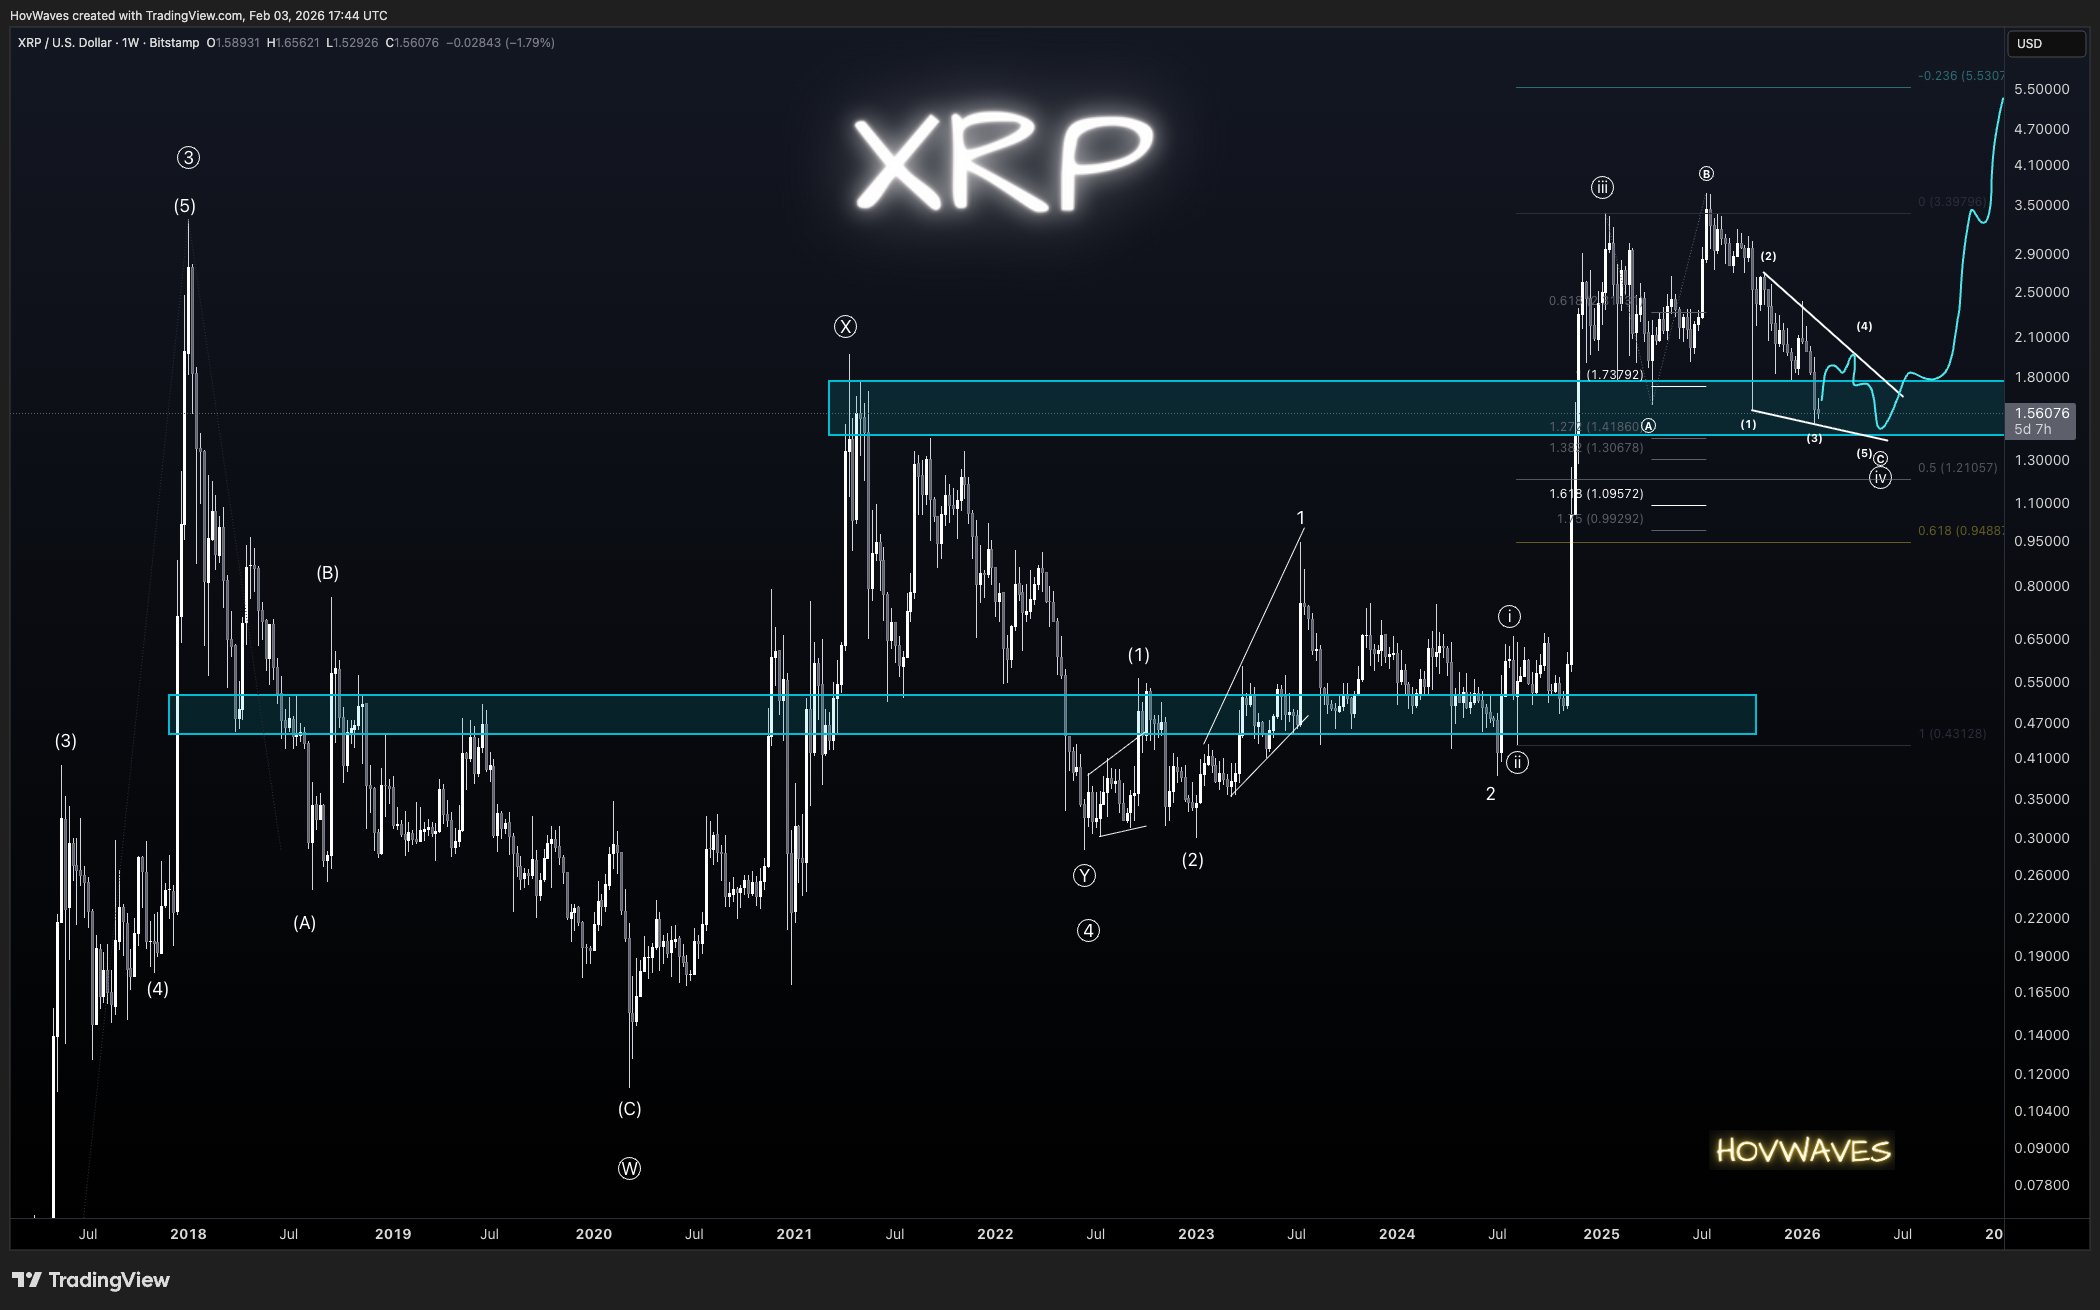
XRP Weekly Chart Tests Key Support as HovWaves Flags $1.43 Line
XRP/USD swept the prior Oct. 10 wick low and then began to stabilize, according to a weekly Bitstamp chart shared by market analyst HovWaves.
The move pushed price back into a long watched support band, which the analyst described as a key level for XRP to hold as the broader structure develops.
XRP U.S. Dollar Weekly Chart. Source: TradingView via HovWaves on X
HovWaves said he is tracking an ending diagonal as the “C” leg of an expanded flat, a corrective pattern used in Elliott Wave analysis.
On his chart, price action compresses into a narrowing sequence while it works around a highlighted support area, with nearby Fibonacci levels and prior swing zones framing the range.
The analyst said XRP must hold $1.43 on a higher time frame. If XRP posts a higher time frame close below that level, he warned that downside conditions could deteriorate quickly.
Disclosure:This article does not contain investment advice or recommendations. Every investment and trading move involves risk, and readers should conduct their own research when making a decision.
Kriptoworld.com accepts no liability for any errors in the articles or for any financial loss resulting from incorrect information.
Tatevik Avetisyan is an editor at Kriptoworld who covers emerging crypto trends, blockchain innovation, and altcoin developments.
She is passionate about breaking down complex stories for a global audience and making digital finance more accessible.
📅 Published: February 5, 2026 • 🕓 Last updated: February 5, 2026
While the crypto market panics, Bitcoin Cash is thriving. BCH has set multiple records in February despite extreme market fear.
The network has seen increased...
Bitcoin traded near $66,505 on the 15-minute BTCUSD index chart as price continued to slide within a descending channel.
The move followed a failed bounce...