


Bitcoin extended its decline on the daily BTC/USD chart from Bitstamp on Feb. 12, sliding to about $67,169 and pressing deeper into a months-long downtrend.
The move followed a sharp breakdown from a rising base that had formed through late December and January.
Stay ahead in the crypto world – follow us on X for the latest updates, insights, and trends!🚀
As a result, price lost the prior consolidation zone near the mid-$80,000s and failed to reclaim the 50-day EMA, which now sits well above spot and caps rebounds.
The structure keeps lower highs and lower lows intact, therefore the broader trend remains bearish.
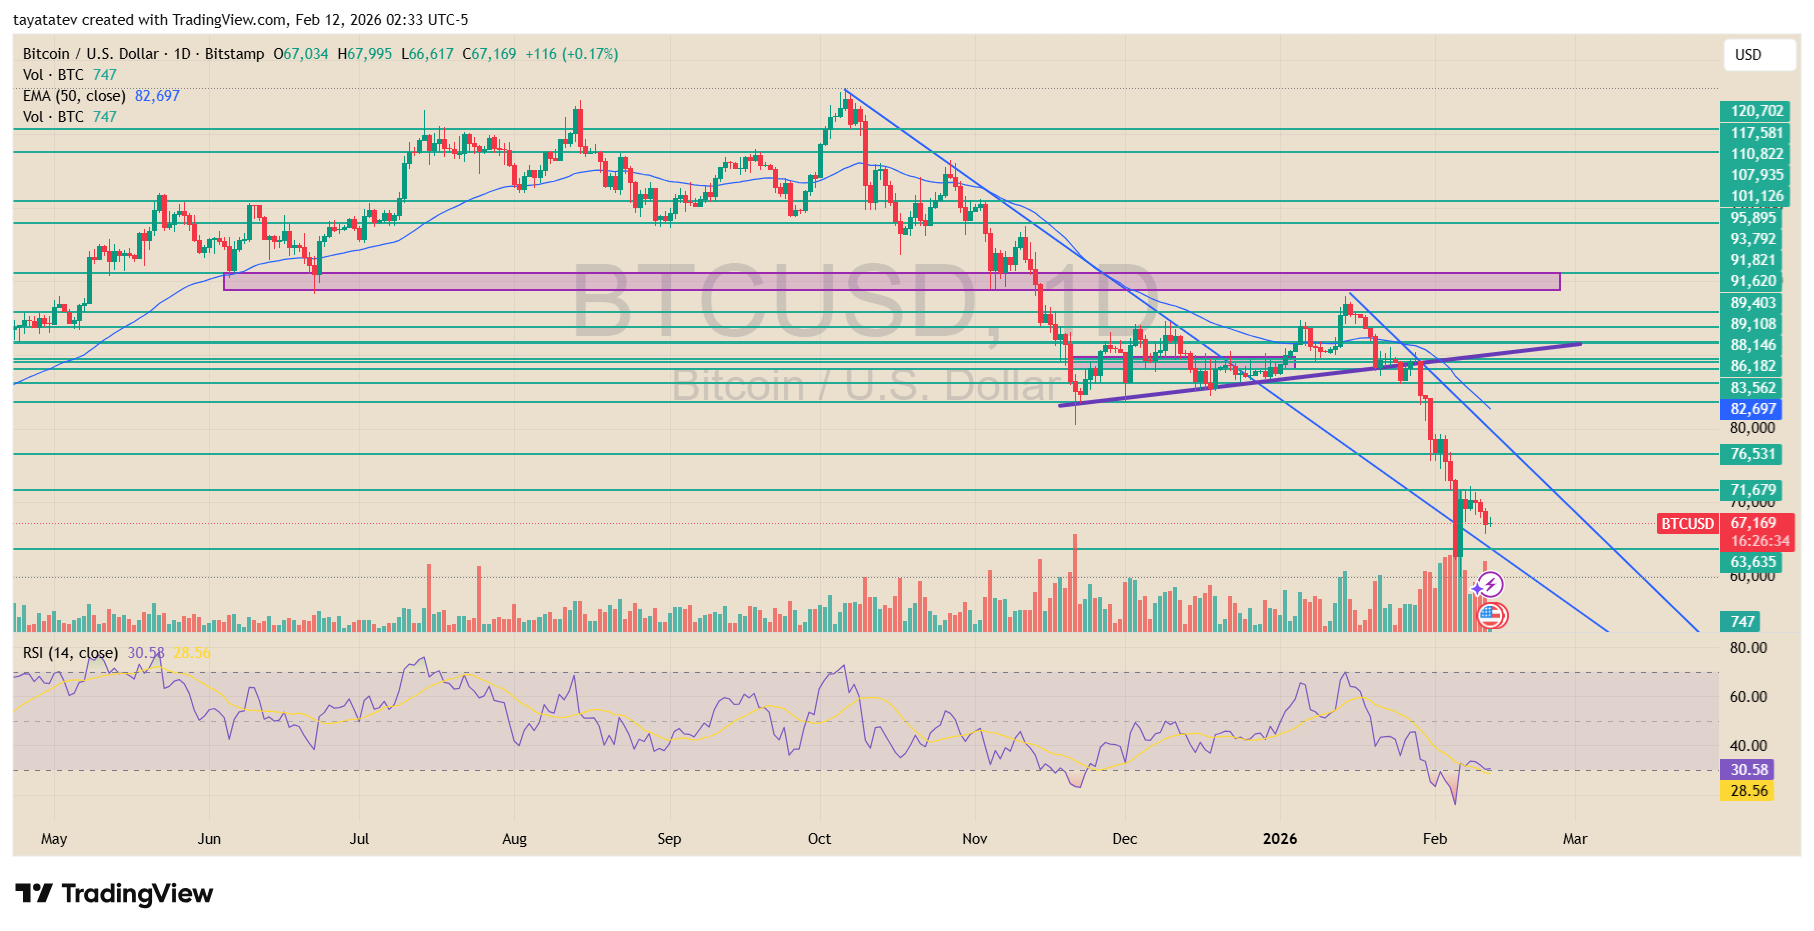
At the same time, the selloff carried price through multiple horizontal levels that had acted as support during earlier pullbacks.
The drop sliced below the $71,679 area and then pushed toward the low-$60,000s zone, which aligns with prior demand on the chart.
Volume expanded during the breakdown, and therefore the move shows stronger participation on the sell side rather than a thin, low-liquidity slide.
In addition, the descending channel drawn from the October peak continues to guide price lower, while the lower channel boundary now frames the near-term path.
Momentum signals also point to sustained pressure. The RSI (14) sits near 30, which places momentum close to oversold levels after a steady series of lower readings.
However, the indicator has not shown a clear bullish divergence, and therefore the momentum picture does not yet signal a trend shift.
Meanwhile, prior support near the mid-$80,000s has flipped into resistance, and price failed to hold above the short-term trendline that had supported the late-January bounce.
Together, these factors show that sellers keep control, while rebounds face overhead pressure from the falling EMA and the upper boundary of the descending channel.
Bitcoin flips support into resistance on 15 minute chart
More Crypto Online said on X that Bitcoin “moved from support to resistance” and that the bounce “is a 3 wave move to the upside.”
The post frames the rebound as corrective, not a clean trend reversal, because price failed to reclaim the former floor and instead started reacting under it.
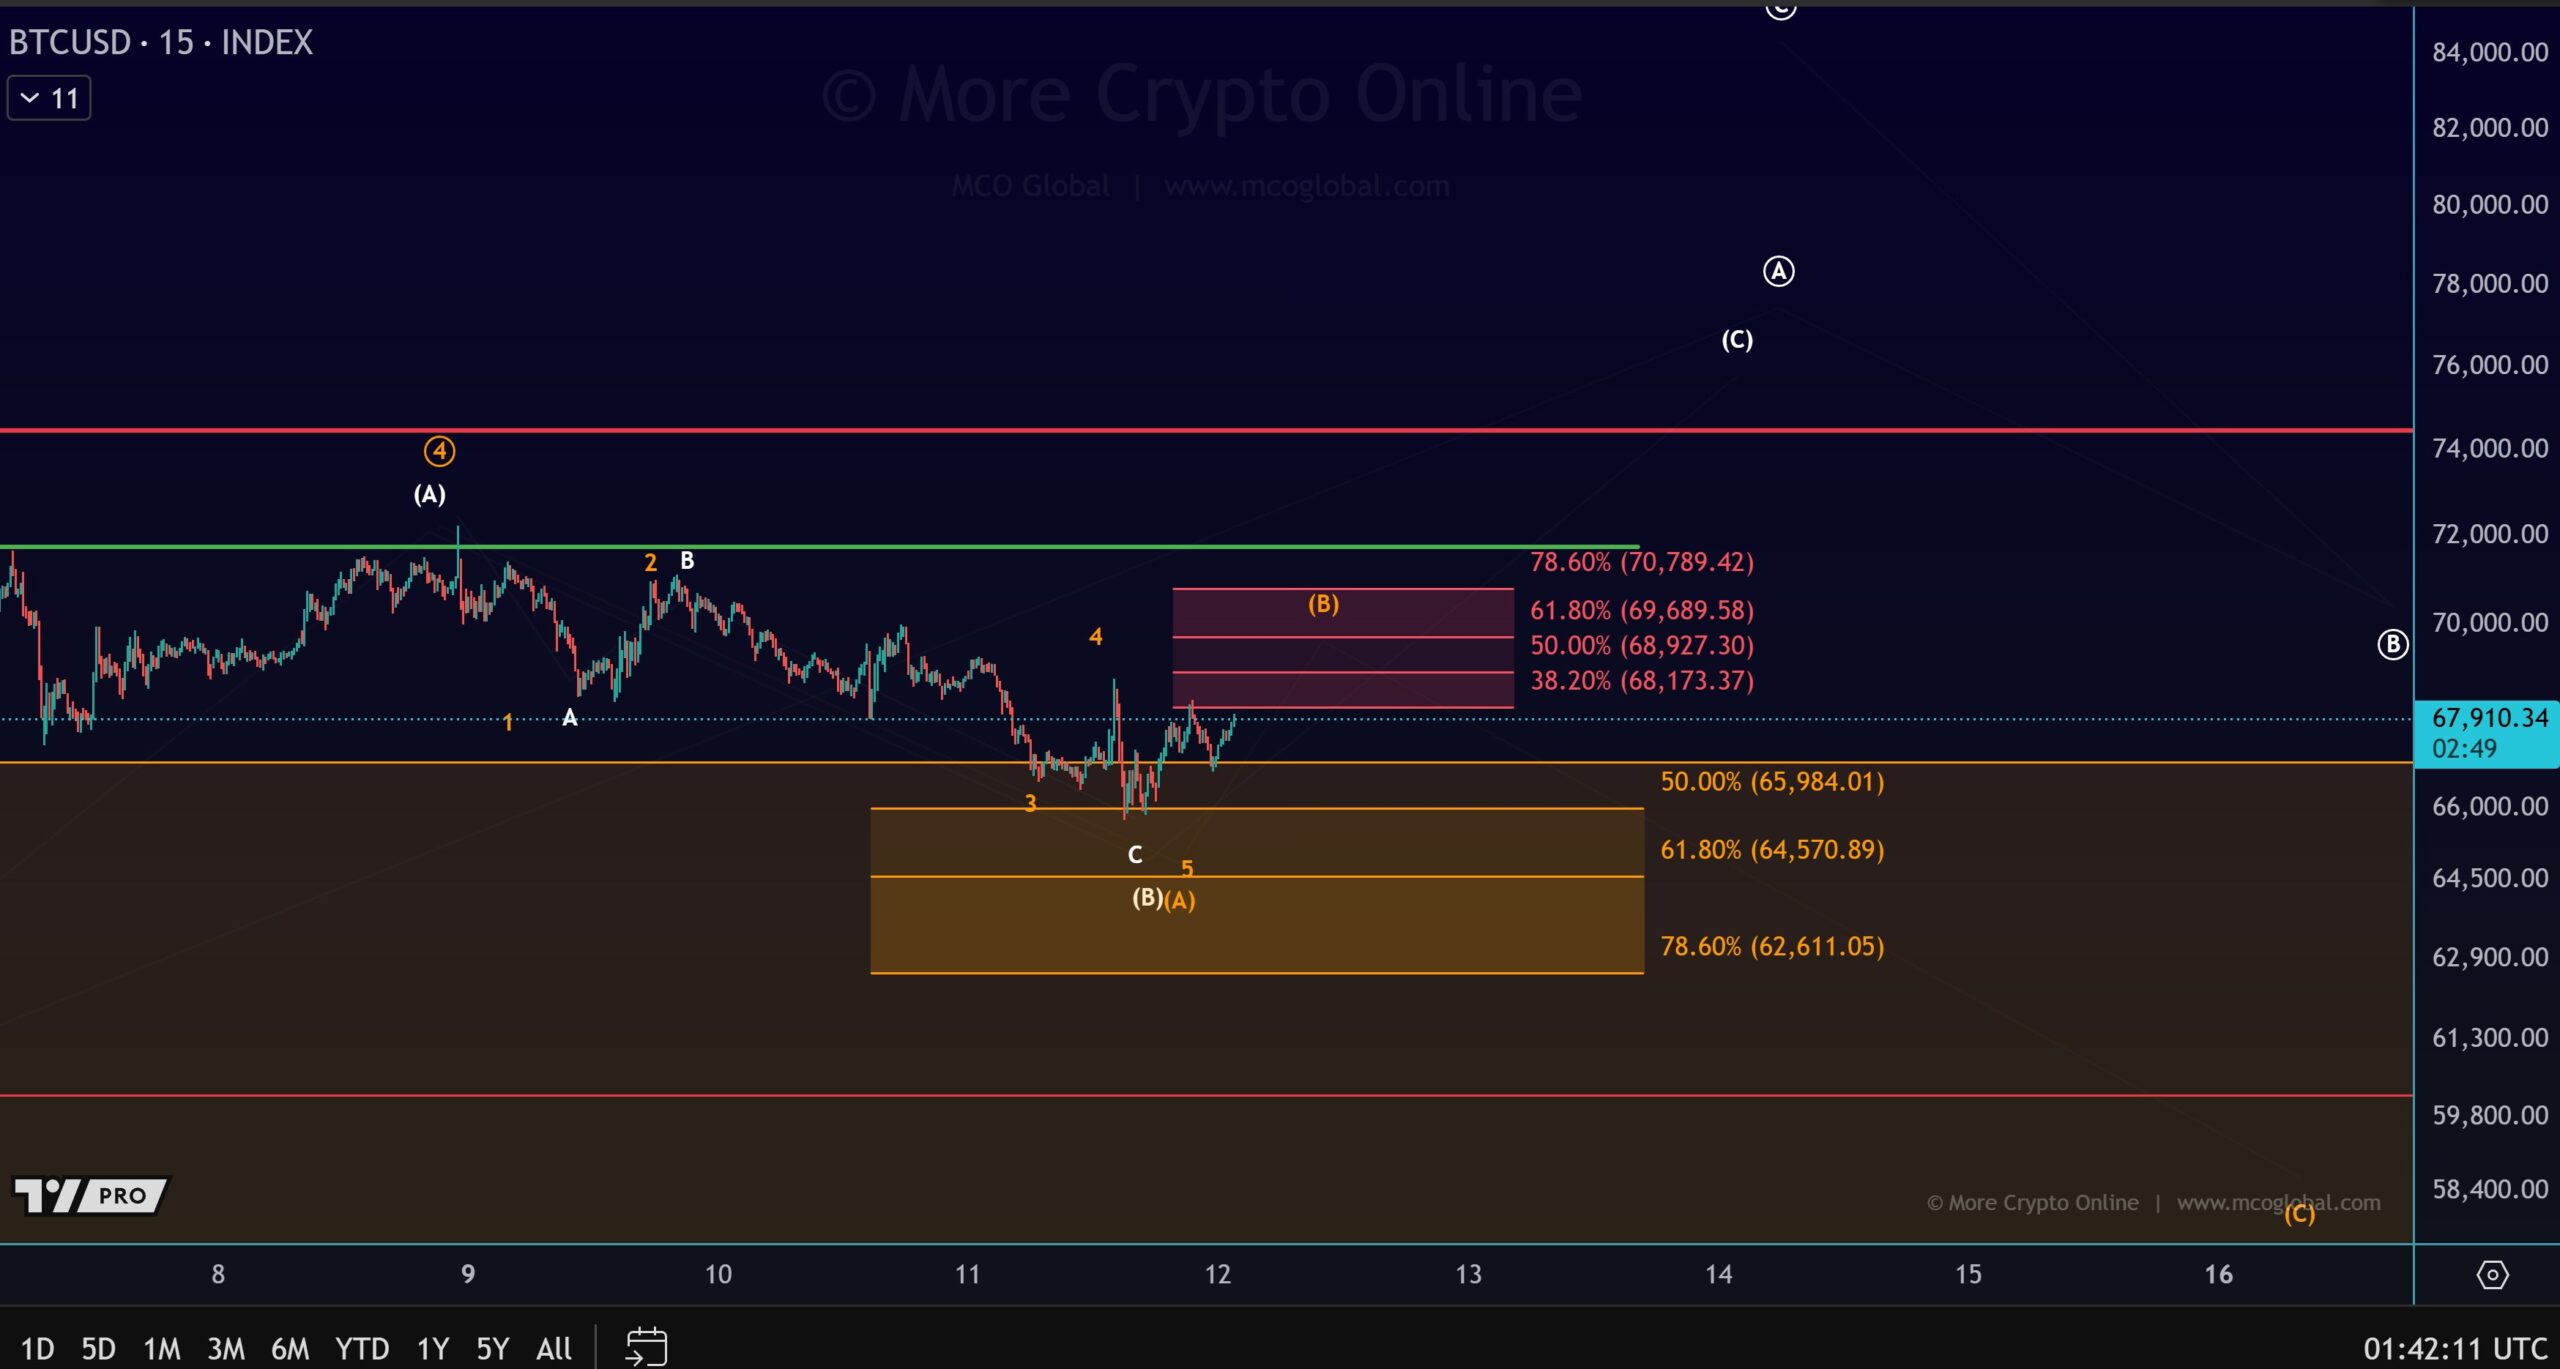
The attached 15 minute BTCUSD chart maps a resistance band using Fibonacci levels clustered around the high $60,000s to low $70,000s.
The highlighted upside box shows 38.2% near $68,173, 50% near $68,927, 61.8% near $69,690, and 78.6% near $70,789. Those levels sit below a wider overhead area near the low $70,000s, which the chart marks as a higher resistance line.
On the downside, the chart highlights a demand zone that starts around the mid $60,000s and extends into the low $60,000s.
The lower box shows 50% near $65,984, 61.8% near $64,571, and 78.6% near $62,611.
If price keeps rejecting the upside retracement band, the chart suggests the market could revisit that lower support area before it builds a stronger base.
Disclosure:This article does not contain investment advice or recommendations. Every investment and trading move involves risk, and readers should conduct their own research when making a decision.
Kriptoworld.com accepts no liability for any errors in the articles or for any financial loss resulting from incorrect information.

Tatevik Avetisyan is an editor at Kriptoworld who covers emerging crypto trends, blockchain innovation, and altcoin developments. She is passionate about breaking down complex stories for a global audience and making digital finance more accessible.
📅 Published: February 12, 2026 • 🕓 Last updated: February 12, 2026
