


Bitcoin traded near $66,918 on Feb. 18 on the daily BTCUSD chart from Coinbase, while a tightening pennant kept price pinned between lower highs and higher lows after a steep selloff from the mid-$90,000s.
The setup revived a debate over whether the pattern extends the downtrend or flips into a squeeze higher, as the consolidation neared its tip.
Stay ahead in the crypto world – follow us on X for the latest updates, insights, and trends!🚀
BTC pennant tightens near $67K as traders watch the next break
In a post on X, market watcher SuperBitcoinBro pointed to the pennant as a continuation pattern, but argued the bearish “measured move” case toward sub-$50,000 “isn’t in the cards,” framing the bigger question as how the bearish setup fails rather than whether it does.
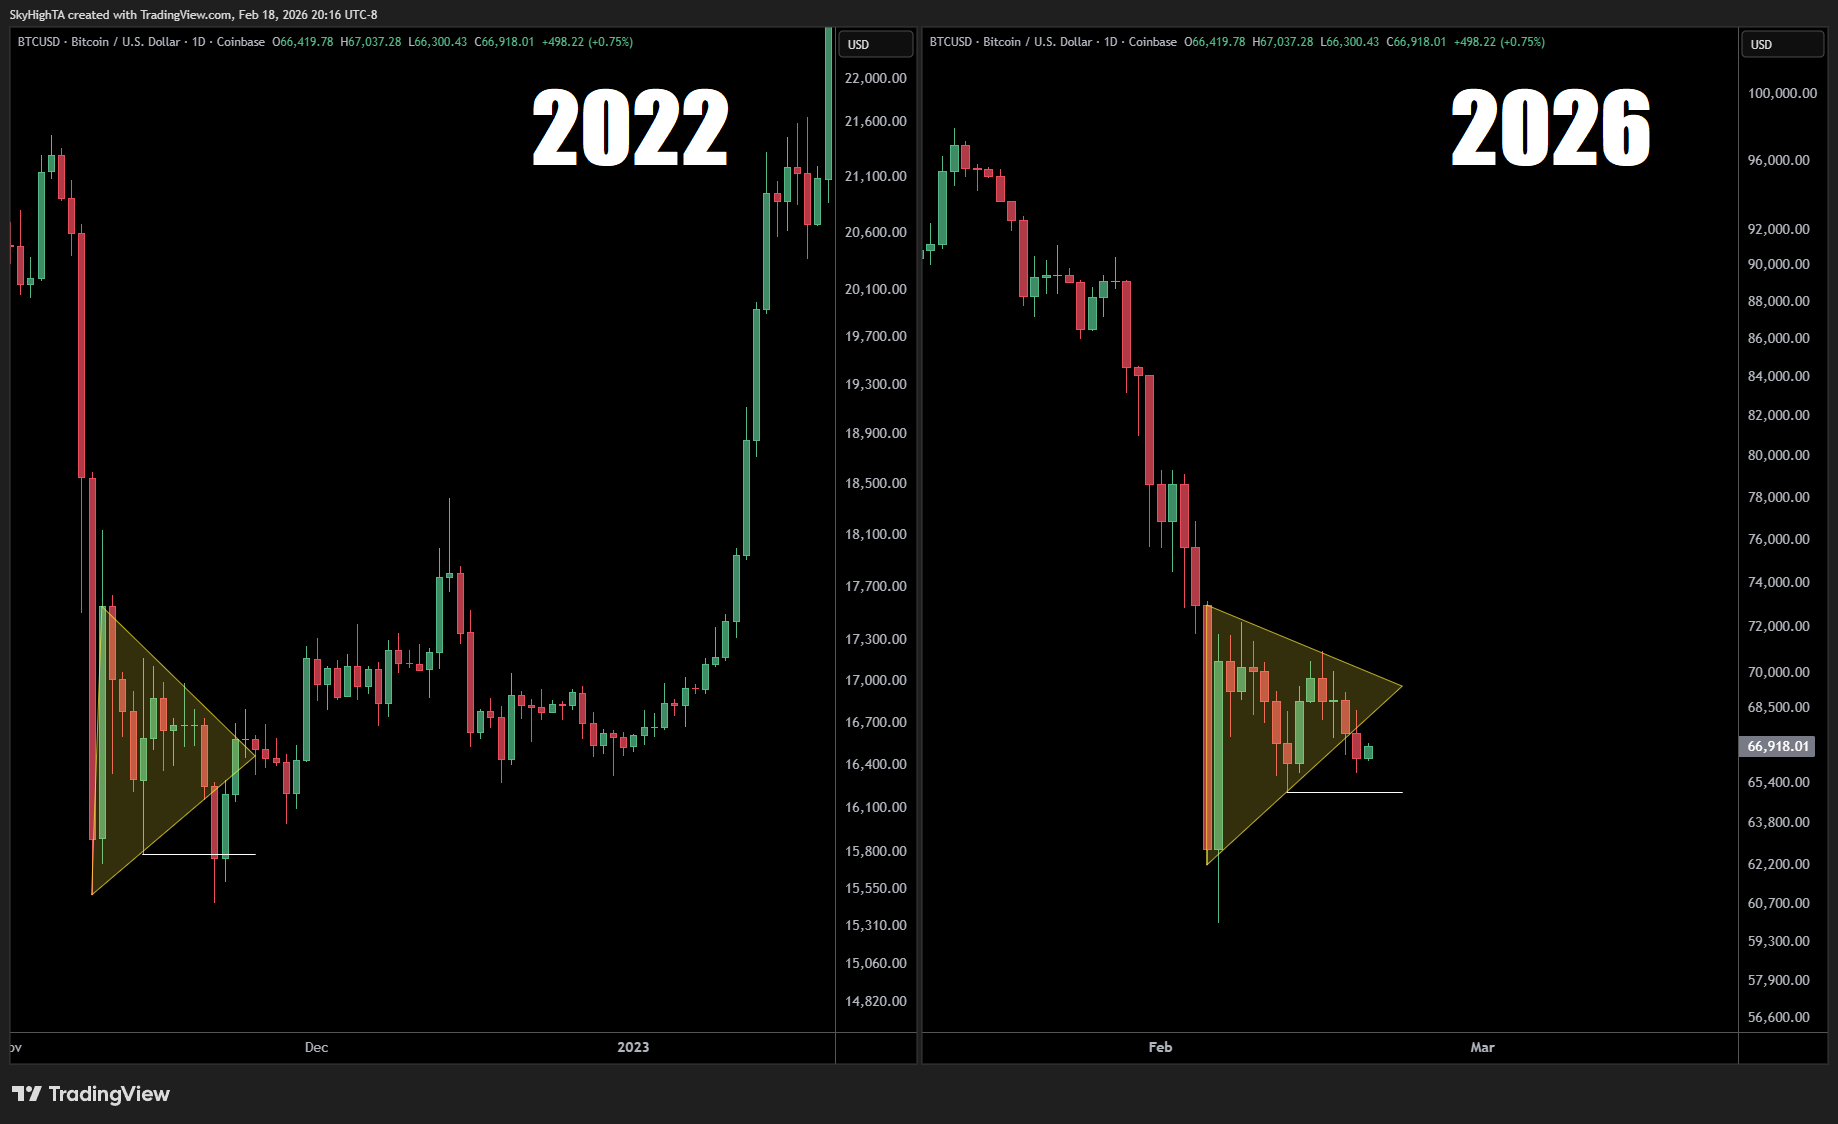
On the chart, the pennant formed after a sharp drop, then compressed as candles chopped inside converging trendlines.
Price also held above a nearby horizontal marker around the mid-$65,000s, which acted like a short term floor during the latest swings.
A clear daily close below that area would keep the prior downtrend in control and put the late wick low near the low-$60,000s back in play.
However, the same compression can fuel a fast reversal if buyers force a clean break through the pennant’s upper boundary.
That would shift focus back to the low-$70,000s region where selling accelerated during the earlier breakdown, and it would pressure shorts that entered during the consolidation.
The image also compares the current structure with a similar 2022 pennant that preceded a sharp rebound, although the chart alone cannot confirm that the same follow through will repeat.
BTC charts map range play as $65K zone stays in focus
In a post on X, trader Tryrex outlined a base case that keeps Bitcoin trading inside a defined range rather than trending.
The sketch on the chart shows price dipping into the mid-$65,000s support band, then rebounding toward the falling trendline near the low-$70,000s before rolling back toward the same support area.
The structure frames the market as rotational, with rallies sold into resistance and pullbacks bought near prior demand.
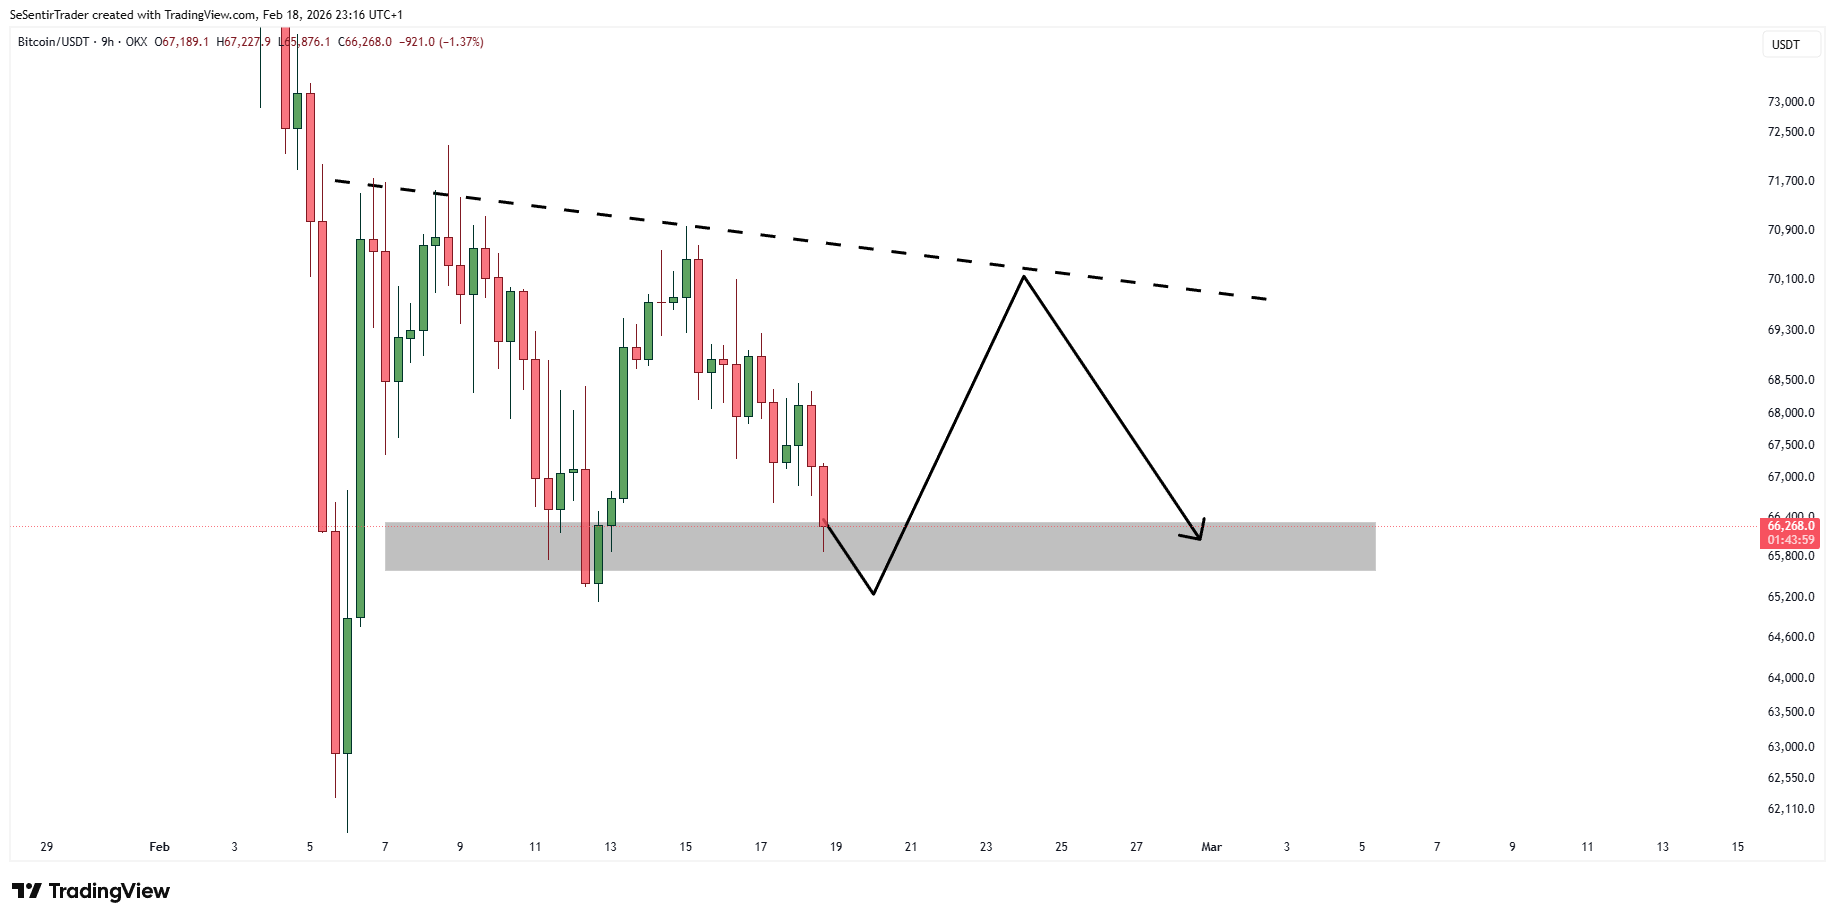
The marked gray band around the mid-$65,000s highlights a zone that absorbed sell pressure more than once earlier in February.
Price action into that area produced sharp wicks and fast rebounds, which kept the range intact. At the same time, the dashed descending trendline caps rebounds near the low-$70,000s, reinforcing a ceiling that sellers defended on prior pushes.
The projection also aligns Bitcoin’s path with Ethereum moving in a similar sideways structure.
That pairing implies broader market balance rather than a one sided trend, as both majors compress between support and resistance.
A daily close that breaks the descending trendline would shift focus toward higher resistance zones, while a clean loss of the mid-$65,000s band would open room toward the low-$60,000s where earlier demand printed during the selloff.
Disclosure:This article does not contain investment advice or recommendations. Every investment and trading move involves risk, and readers should conduct their own research when making a decision.
Kriptoworld.com accepts no liability for any errors in the articles or for any financial loss resulting from incorrect information.

Tatevik Avetisyan is an editor at Kriptoworld who covers emerging crypto trends, blockchain innovation, and altcoin developments. She is passionate about breaking down complex stories for a global audience and making digital finance more accessible.
📅 Published: February 19, 2026 • 🕓 Last updated: February 19, 2026
