


XRP perpetual futures on Binance showed a negative aggregated funding rate for a fourth straight week, based on a chart shared by X user Web3Niels.
The open interest weighted eight hour average sat near minus 0.0084, while XRPUSDT traded around 1.46 on the weekly view.
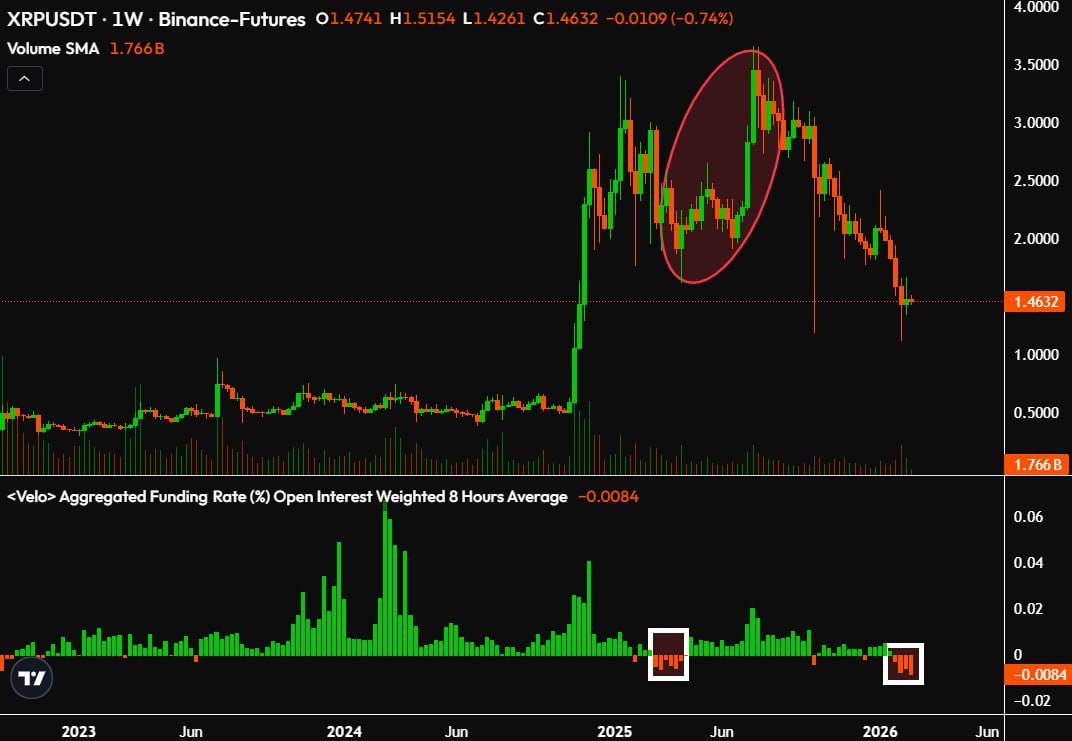
Negative funding usually means shorts pay longs to keep positions open. As a result, it often signals that traders still lean bearish in derivatives, even when spot price does not break down in a straight line.
Web3Niels compared the current stretch to Q1 2025, when funding stayed negative and XRP later rallied about 120%. That pattern can repeat if price stabilizes and then pushes higher, because short positioning can fuel a squeeze once traders rush to cover.
Still, funding does not act as a clean buy signal. If price keeps making lower highs and lower lows, the rate can remain negative while the market trends down, especially when traders use futures to hedge spot exposure.
On the weekly chart, XRP has faded after a strong run into the 3.50 to 4.00 area, and sellers have capped rebounds since then.
The latest candle showed a close near 1.4632 after trading between about 1.4261 and 1.5154, which kept price near the lower end of the recent decline.
If XRP holds around the 1.45 area and starts reclaiming nearby resistance, the long negative funding streak can become squeeze fuel and push a fast rebound.
However, if price loses that zone while funding stays negative, traders can read it as trend confirmation and keep pressure on downside levels.
XRP Holds Long-Term Ascending Channel as Fibonacci Levels Mark Upper Targets
XRP price action has tracked inside a rising trend channel since 2017 on the monthly chart shared by X user Dark Defender.
The structure shows higher swing lows holding along the lower boundary of the channel, while price has respected the upper boundary during major rallies.
As a result, the long term trend still points higher on this view, even after deep pullbacks between cycles.
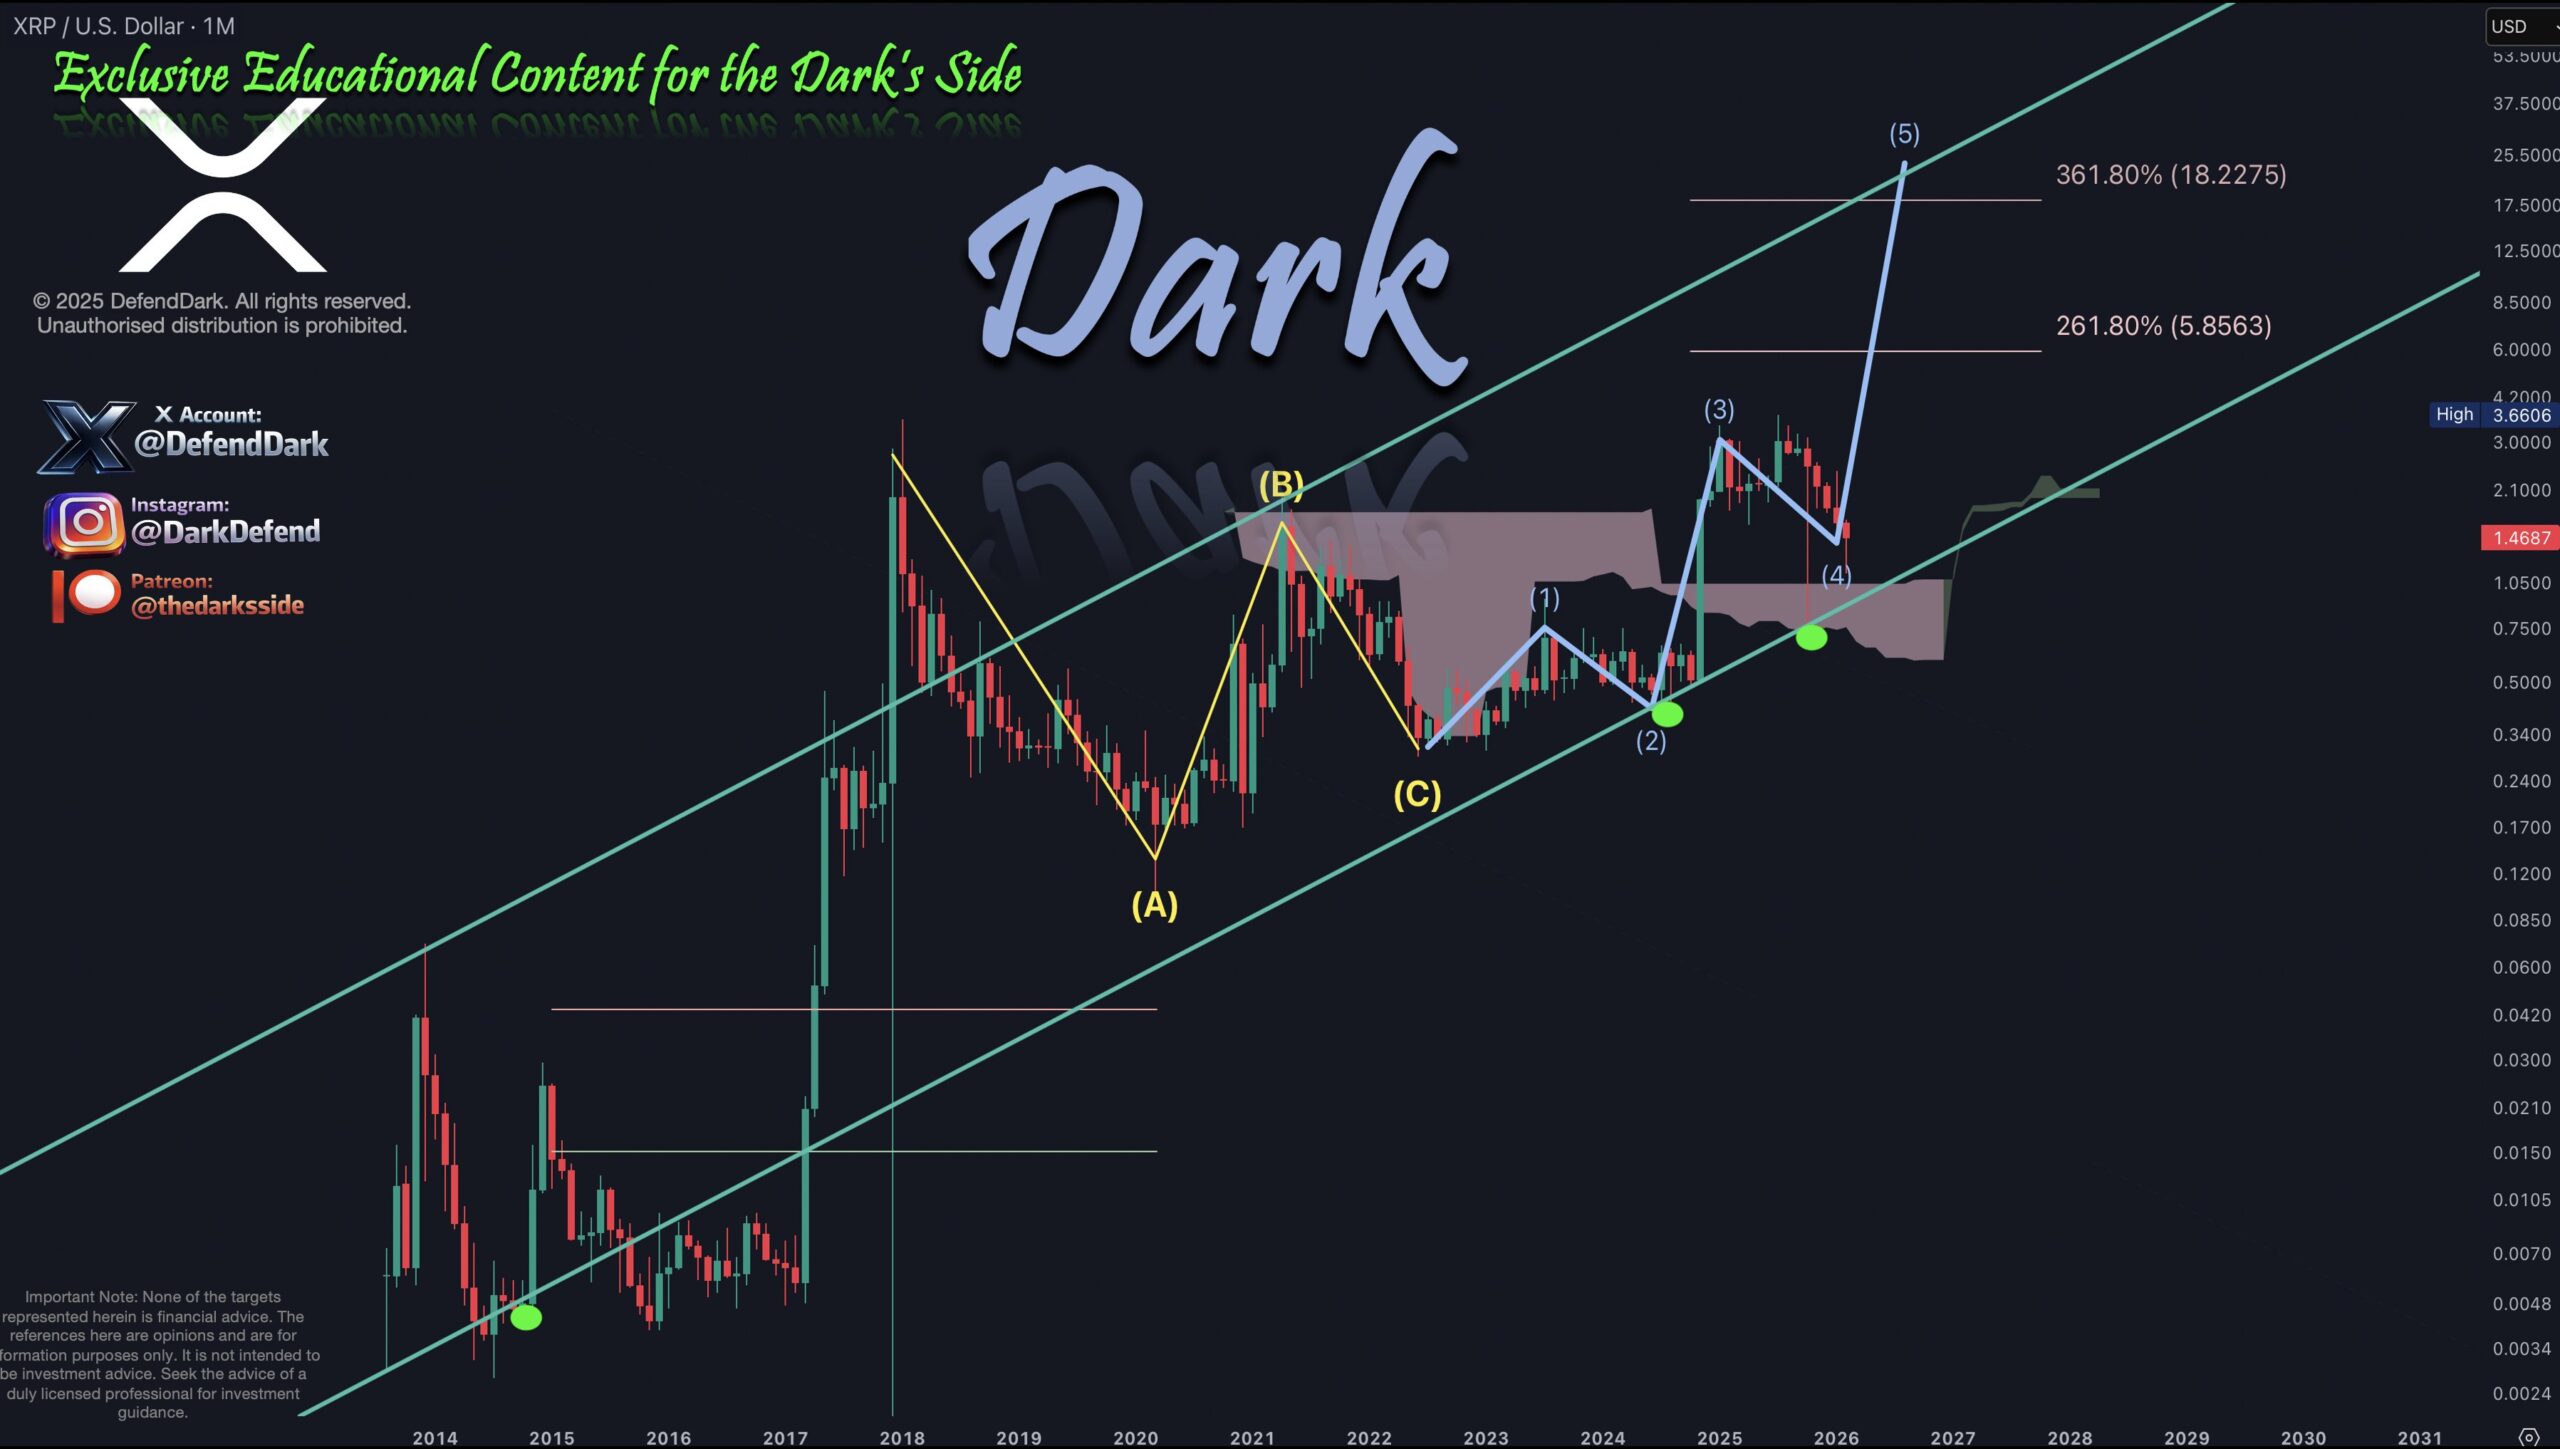
The chart also outlines a broad W-shaped recovery structure across multiple years, with price rebounding from major lows and rebuilding higher ranges inside the same channel.
That formation intersects with upper Fibonacci extension levels drawn from the prior cycle range.
In this setup, the 261.8% and 361.8% extensions sit well above current price, which frames the upper channel as a long term target zone if the structure stays intact.
However, the monthly candles still show wide swings between expansions and long consolidations.
Therefore, price has tended to move in phases rather than in a straight line toward the upper band. The trend channel remains valid only while XRP holds the rising support line that has guided price since the 2017 cycle.
From a forward looking view, continuation toward the upper channel would require XRP to keep printing higher monthly lows and to clear prior cycle highs with follow through.
If price loses the lower channel support on a monthly close, the long term channel thesis weakens and the structure can reset before any renewed advance toward higher Fibonacci extensions.
Disclosure:This article does not contain investment advice or recommendations. Every investment and trading move involves risk, and readers should conduct their own research when making a decision.
Kriptoworld.com accepts no liability for any errors in the articles or for any financial loss resulting from incorrect information.

Tatevik Avetisyan is an editor at Kriptoworld who covers emerging crypto trends, blockchain innovation, and altcoin developments. She is passionate about breaking down complex stories for a global audience and making digital finance more accessible.
📅 Published: February 19, 2026 • 🕓 Last updated: February 19, 2026
