


Bitcoin broke below a descending pennant structure on the 4 hour BTCUSD chart, but price action has not expanded into a clear trend yet.
Instead, BTC continues to consolidate in a narrow range, holding just above short term support.
Stay ahead in the crypto world – follow us on X for the latest updates, insights, and trends!🚀
The move signals a structural change, but follow through remains limited as traders wait for confirmation.
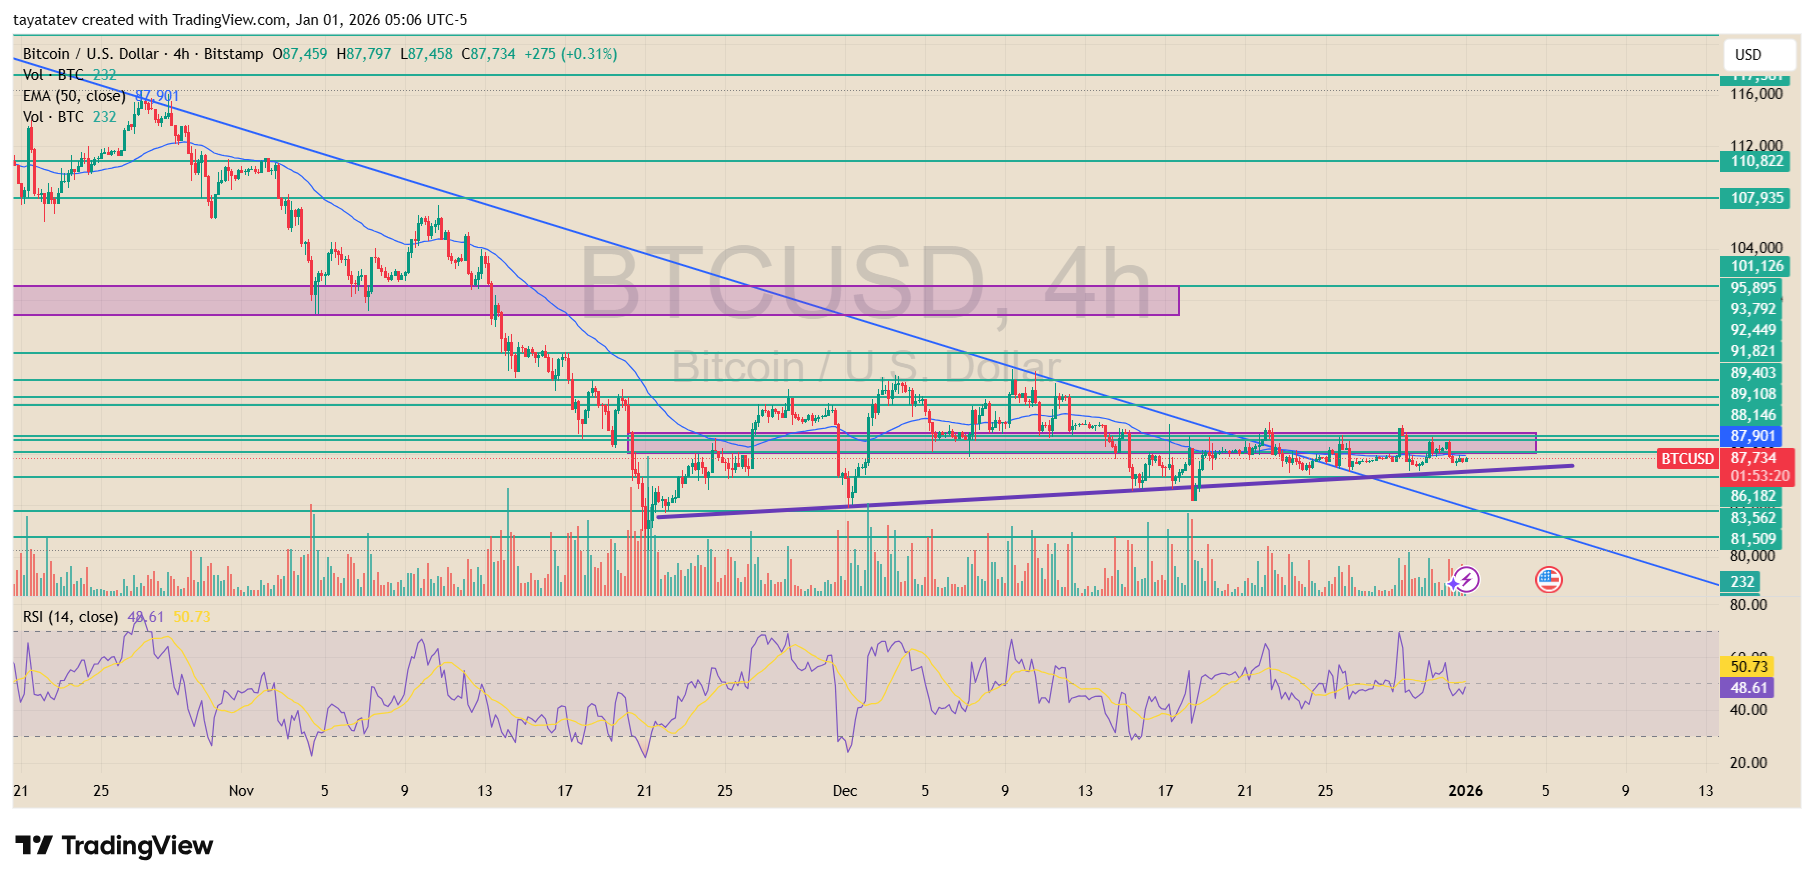
After the break, Bitcoin settled into a fair value gap zone around the mid to upper $87,000 area. Price continues to rotate inside this zone, showing balanced buying and selling pressure.
This behavior suggests the market is still processing the breakdown rather than committing to a strong directional move. As long as BTC trades inside this fair value gap, volatility may stay compressed.
On the upside, the chart shows room for a push toward the $89,000 level. That area aligns with prior intraday resistance and sits near overlapping horizontal levels.
If price reclaims and holds above the upper edge of the fair value gap, BTC could attempt a short term recovery into that zone. Such a move would still fit within a broader consolidation rather than signal a trend reversal.
However, the downside risk remains active. A clean rejection from the fair value gap, followed by a loss of the rising support trendline, would strengthen the bearish case.
In that scenario, the pennant break would act as confirmation that the broader downtrend is resuming. Price could then rotate toward lower support levels seen earlier in December.
Momentum indicators reflect the indecision. The RSI hovers near the mid range, showing neither overbought nor oversold conditions.
This reading supports the view that the market is pausing rather than trending. Volume also remains muted, reinforcing the consolidation narrative.
In summary, Bitcoin has broken its pennant structure, but price has not accelerated.
The market now trades inside a fair value gap, where a push toward $89,000 remains possible.
At the same time, failure to hold current levels would shift focus back to downside continuation. Until one side takes control, BTC is likely to remain range bound.
Bitcoin Flashes Bullish MACD Crossover on Higher Time Frame
Bitcoin printed a bullish MACD crossover on the 3 day BTCUSD chart, signaling a potential momentum shift after a prolonged pullback.
The signal appeared as the MACD line crossed above the signal line deep below the zero level, a zone historically linked with trend resets rather than short term bounces.
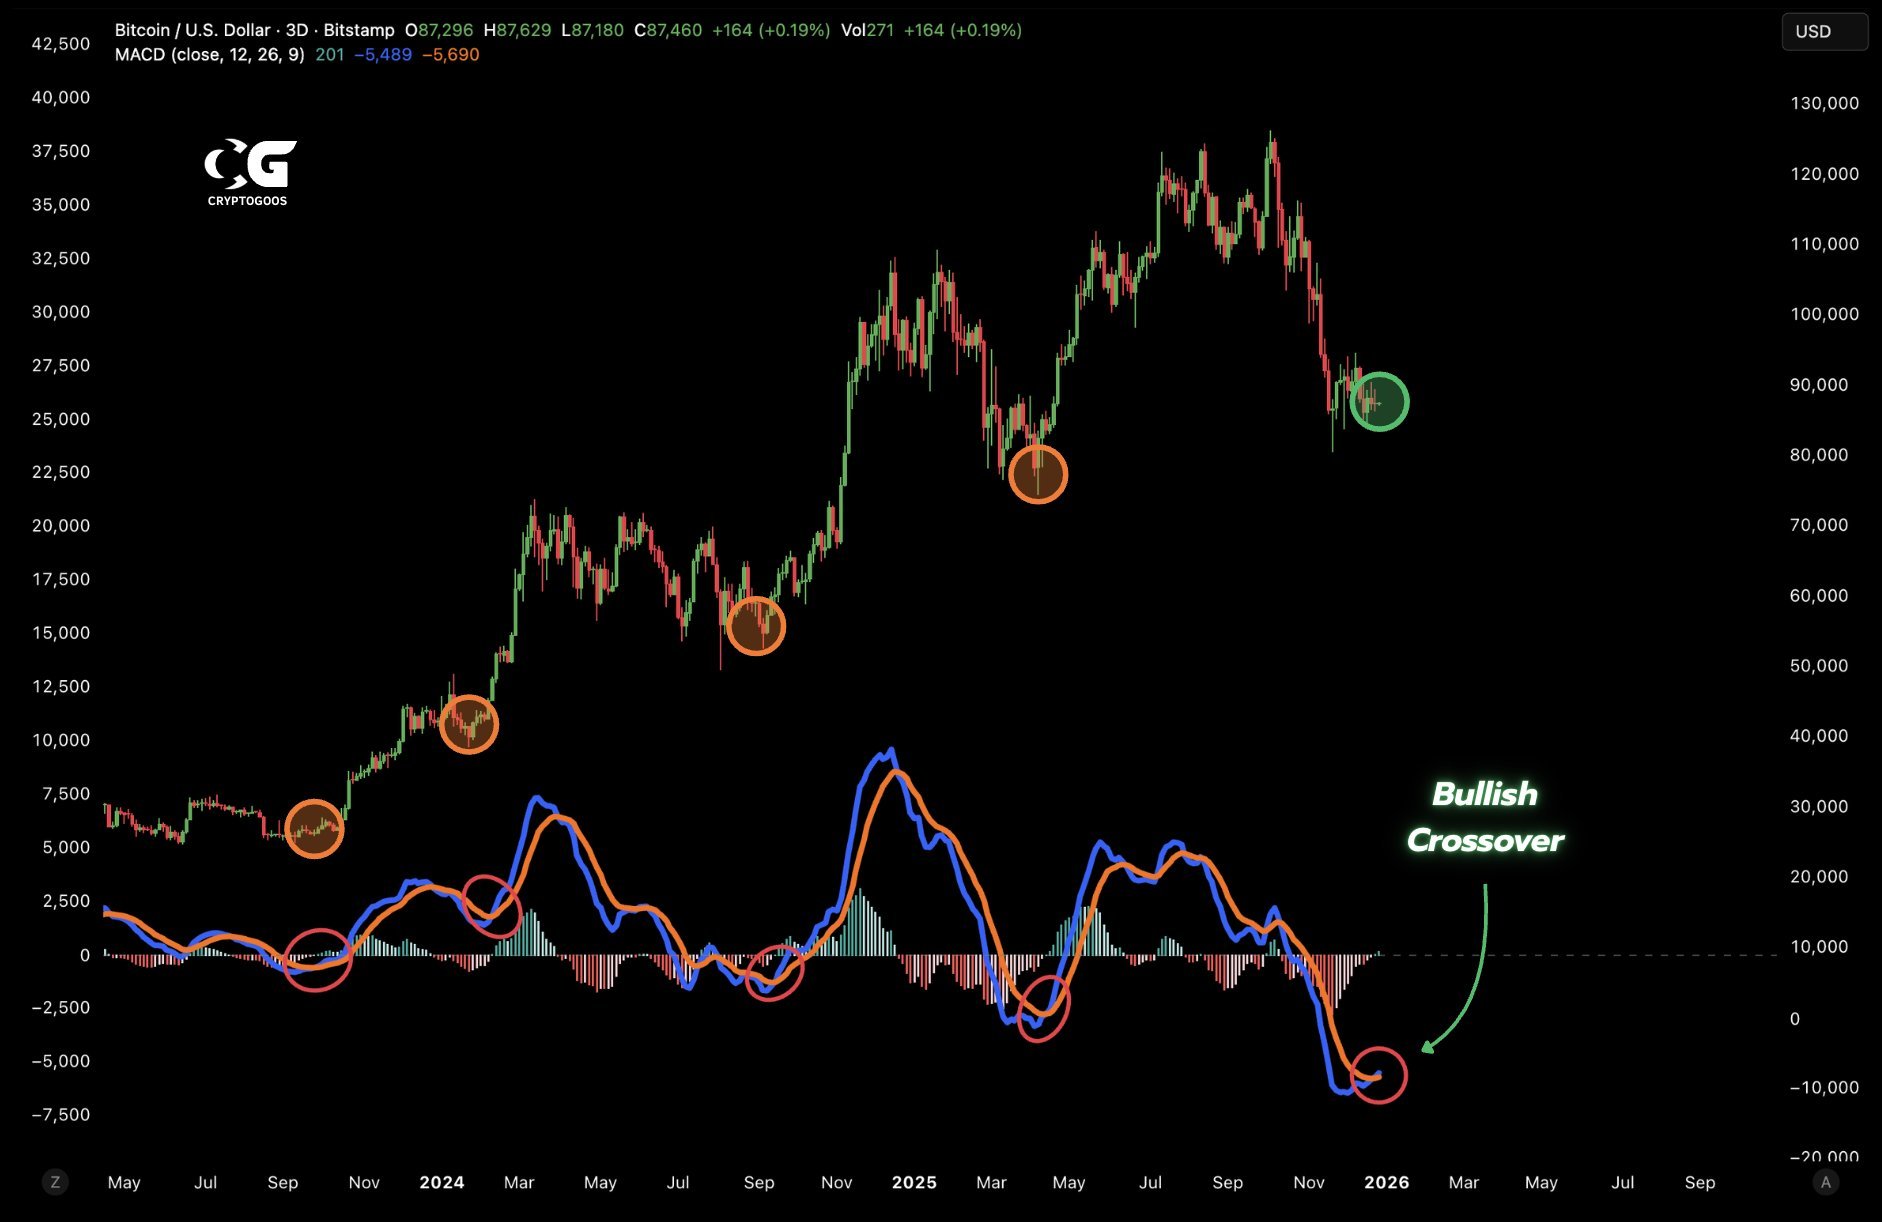
The chart shows similar MACD crossovers during earlier market cycles, marked near major corrective lows.
In those past instances, Bitcoin transitioned from downside pressure into broader upside expansions.
While each cycle unfolded differently, the common feature was momentum turning positive before price followed.
Price action remains below recent highs, and Bitcoin continues to trade well under the prior peak zone above $110,000. However, the current structure shows stabilization near the mid $80,000 range.
This base formation aligns with the momentum shift on the MACD, suggesting selling pressure may be easing rather than accelerating.
The MACD histogram also started to contract on the negative side, which supports the crossover signal.
This contraction reflects weakening downside momentum rather than aggressive buying.
As a result, the signal points to a possible transition phase instead of an immediate breakout.
Despite the bullish crossover, confirmation still depends on price behavior. Bitcoin needs to hold current levels and build higher lows to validate a sustained trend change.
Failure to do so would keep the move within a broader corrective structure.
For now, the higher time frame momentum signal stands out. Bitcoin shows early signs of recovery pressure building, but price must follow through to shift the broader trend.
Disclosure:This article does not contain investment advice or recommendations. Every investment and trading move involves risk, and readers should conduct their own research when making a decision.
Kriptoworld.com accepts no liability for any errors in the articles or for any financial loss resulting from incorrect information.

Tatevik Avetisyan is an editor at Kriptoworld who covers emerging crypto trends, blockchain innovation, and altcoin developments. She is passionate about breaking down complex stories for a global audience and making digital finance more accessible.
📅 Published: January 1, 2026 • 🕓 Last updated: January 1, 2026
