


Bitcoin traded on Bitstamp’s daily chart dated Jan. 7, 2026, after pushing into a clearer uptrend attempt and breaking above a long, descending downtrend line that had capped price since the October peak.
The session showed BTC around $92,766, while the 50 day EMA sat near $91,744, keeping price just above a key trend filter as buyers tried to extend the rebound.
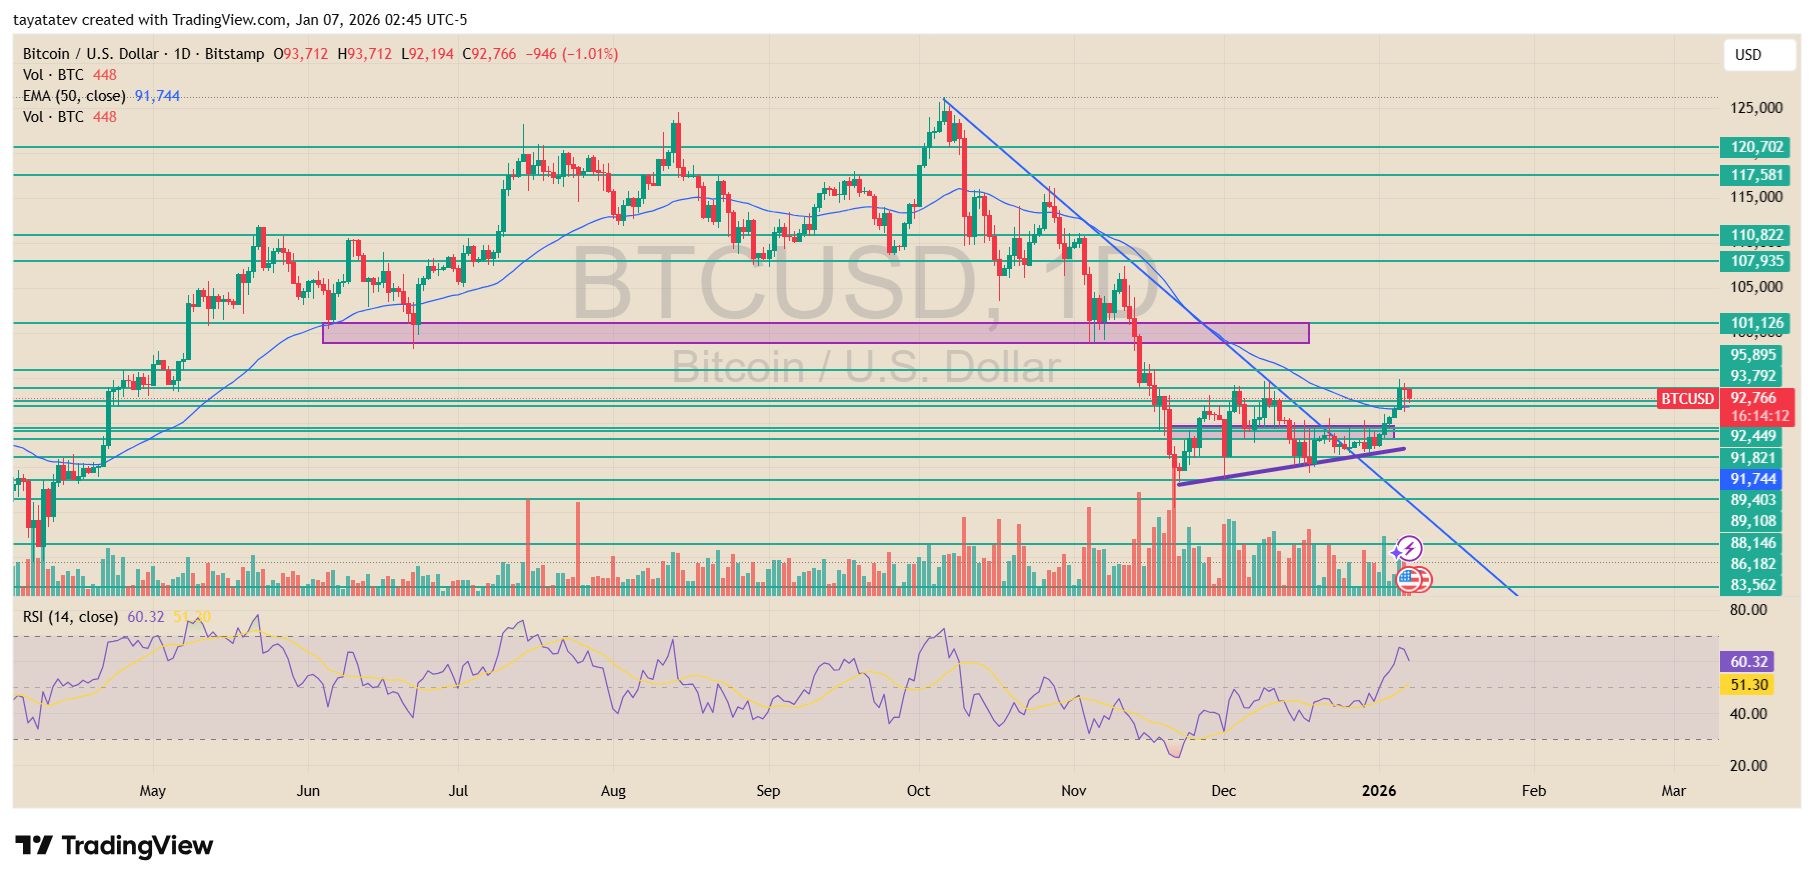
The chart shows a clean shift from lower highs into higher lows through late December and early January.
Price climbed off the December base and then moved above the descending blue trendline, which now flips from overhead resistance into a line the market can retest for support.
At the same time, BTC held above the rising purple support line under recent lows, which keeps the short term structure tilted upward as long as price stays above that slope.
BTC now sits between nearby support and the next resistance bands marked on the chart.
The closest support levels cluster around $92,449 and $91,821, with the $91,744 EMA acting as an additional support check.
If BTC loses that area on a daily close, the breakout weakens and the chart risks sliding back toward the high $80,000s, where levels such as $89,403 and $88,146 appear on the scale.
On the upside, BTC faces a step by step resistance ladder before the market can argue for a broader recovery.
The first ceiling sits around $93,792 and then $95,895, which align with prior reaction zones.
After that, traders often treat $100,000 as the line that can confirm strength, and the chart’s nearby level at $101,126 reinforces that area as the next major decision zone.
A daily push and hold above $100,000 would strengthen the case that the breakout is real and that BTC can challenge the higher bands above, including the zone leading toward the prior peak area and potential new all time highs.
BTC defends breakout zone as traders watch December highs
Bitcoin held its breakout area overnight on the 12 hour BTCUSDT chart, but sellers pushed back for a second attempt as price hovered near $92,786 early Jan. 7.
The chart shows BTC reclaiming a descending resistance line and then consolidating above it, which keeps the latest move intact as long as price stays above the prior breakout region.
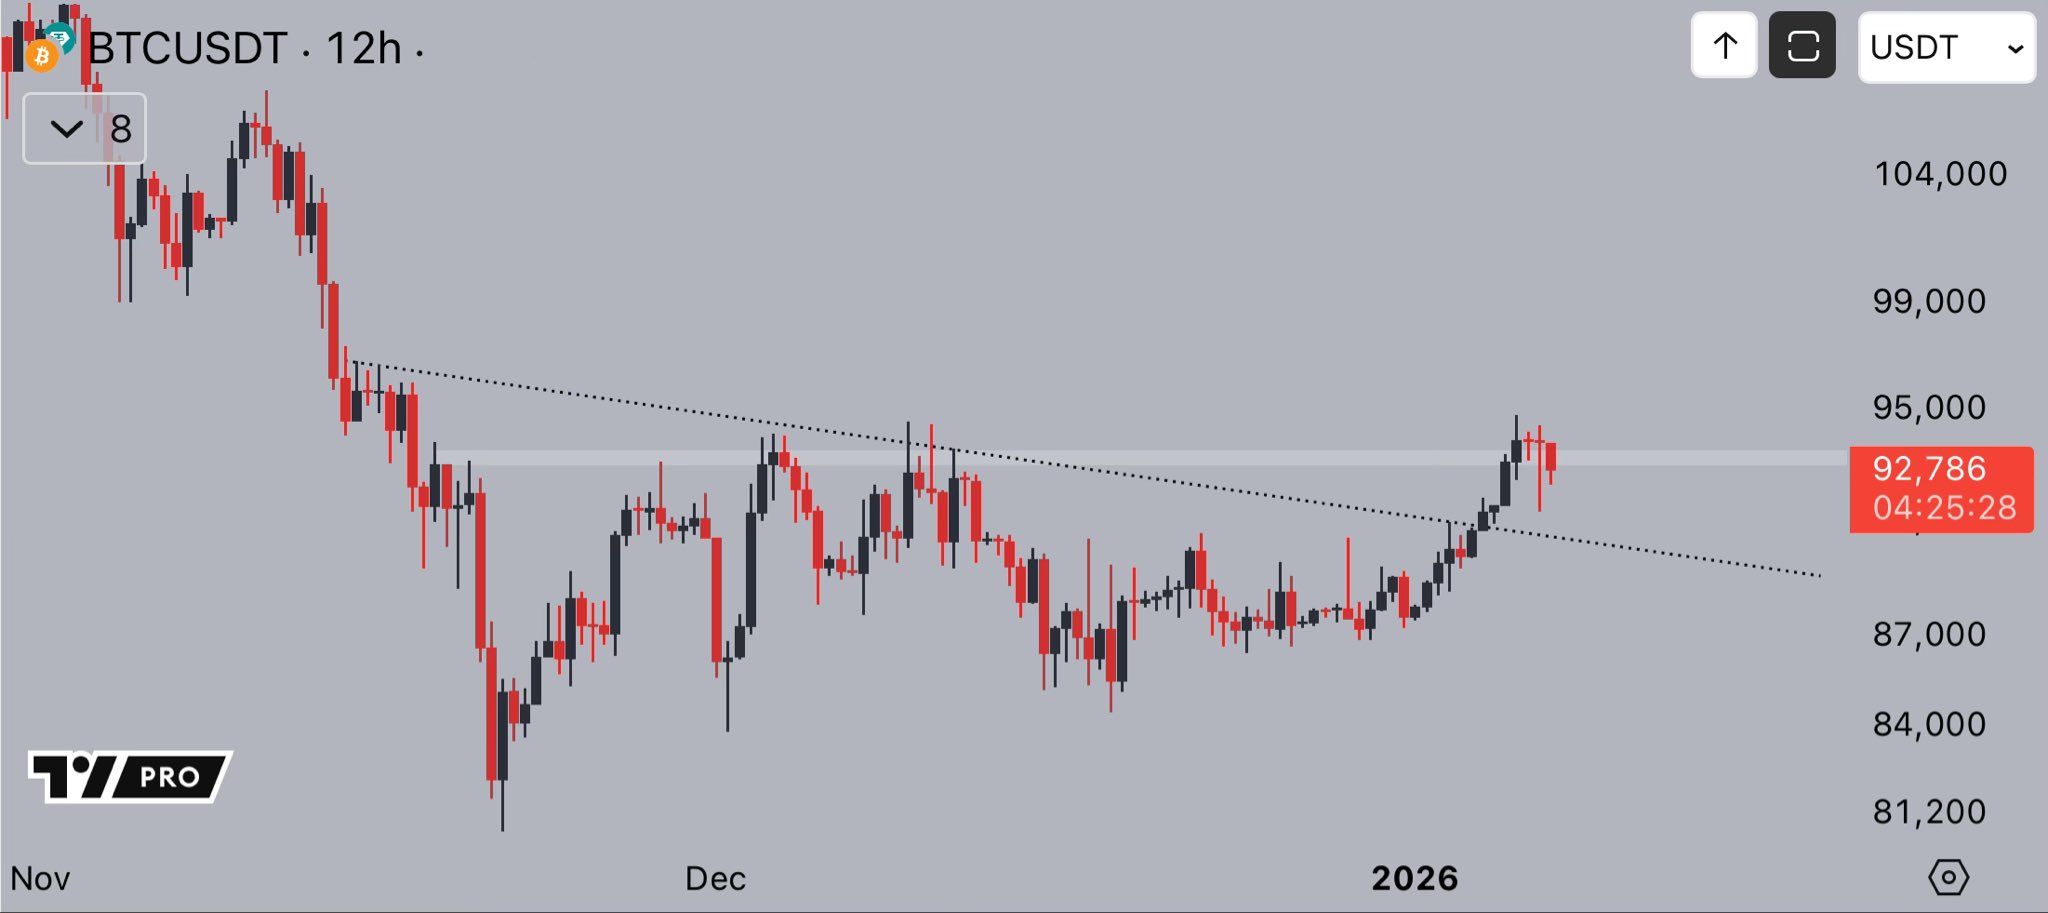
Crypto analyst Jelle said the market defended the breakout area “overnight,” while “bears” tried again to force a reversal.
He added that holding above the December highs could open the way for another push toward $100,000.
A move back to the $100,000 area would mark the next major resistance test on this setup, following the rebound from late 2025 lows and the recent higher swing into early 2026.
Disclosure:This article does not contain investment advice or recommendations. Every investment and trading move involves risk, and readers should conduct their own research when making a decision.
Kriptoworld.com accepts no liability for any errors in the articles or for any financial loss resulting from incorrect information.

Tatevik Avetisyan is an editor at Kriptoworld who covers emerging crypto trends, blockchain innovation, and altcoin developments. She is passionate about breaking down complex stories for a global audience and making digital finance more accessible.
📅 Published: January 7, 2026 • 🕓 Last updated: January 7, 2026
