


Bitcoin sank to the mid $60,000s on Feb. 6, sliding to about $66,218 on the daily BTCUSD chart from Bitstamp.
Price printed a session low near $59,930 before rebounding, after opening around $62,795 and topping near $66,746.
Stay ahead in the crypto world – follow us on X for the latest updates, insights, and trends!🚀
The bounce left a large wick under the candle, but the session still reflected forced downside momentum after the drop.
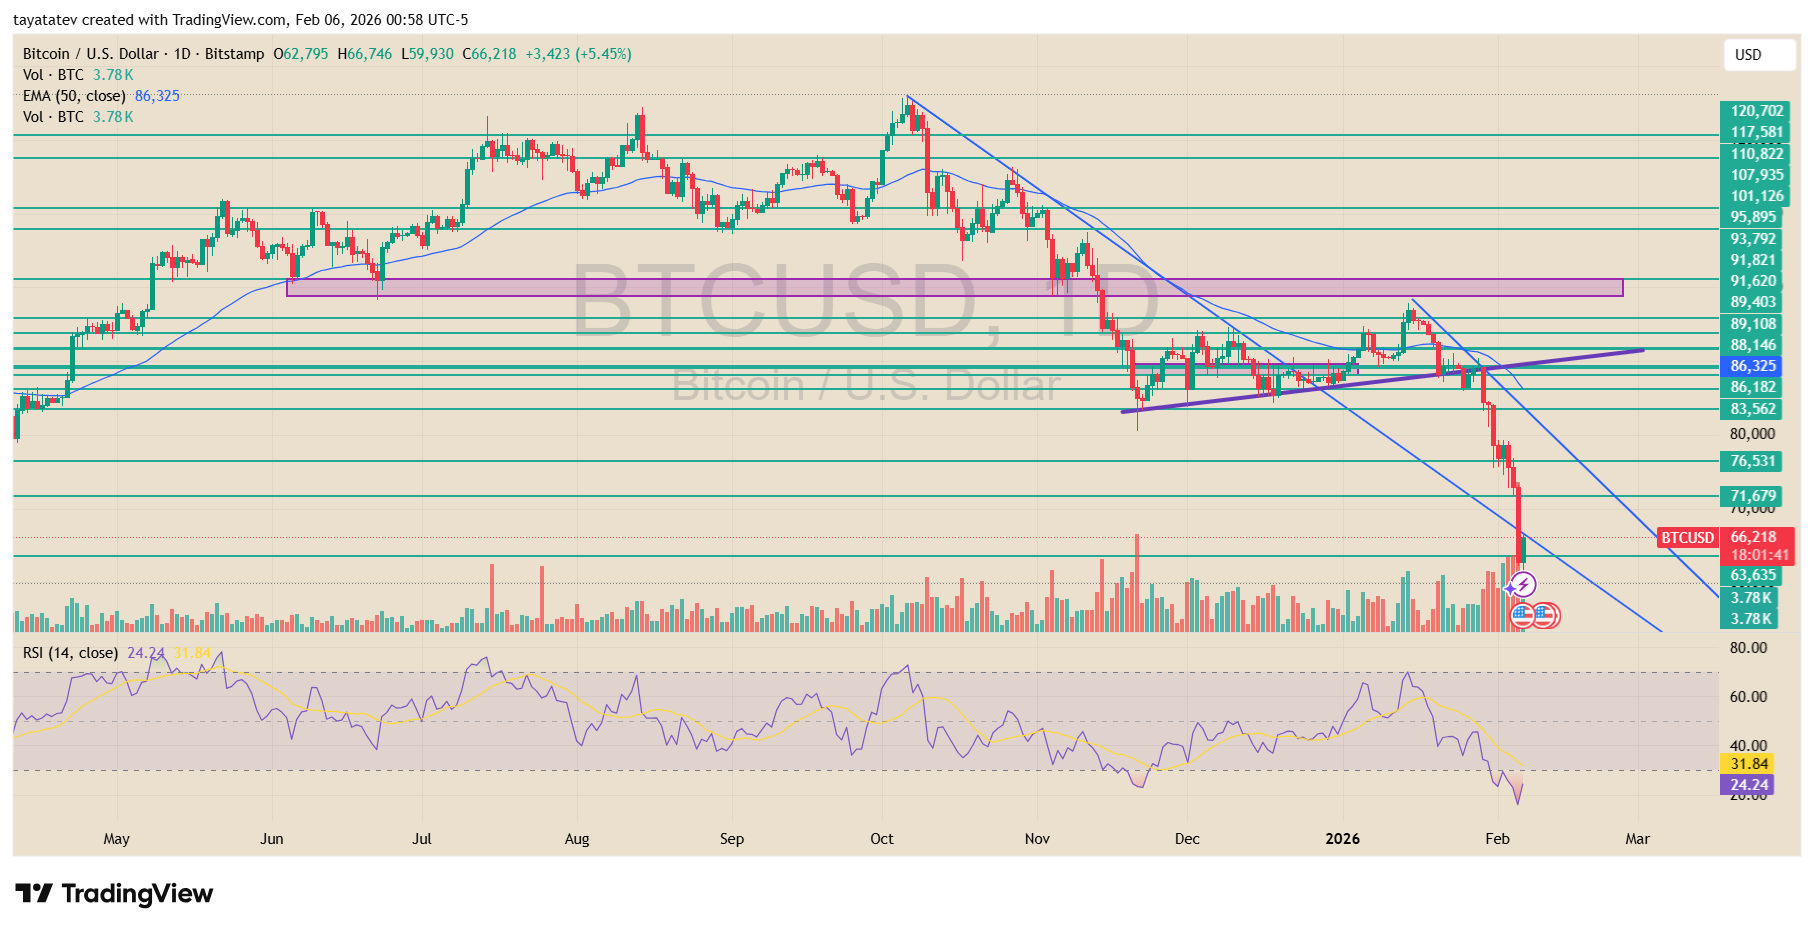
The chart shows Bitcoin breaking below multiple horizontal support lines that previously held through late 2025 and early 2026.
At the same time, price stayed well under the 50 day exponential moving average, which sat near $86,325 and continued to slope lower. That gap highlighted how far price moved from the recent equilibrium zone as the downtrend tightened.
Bitcoin also remained inside a descending price channel marked by two blue parallel trendlines.
After a short consolidation in January, price rolled over and accelerated lower within that channel.
As a result, former support areas around the low $70,000s and mid $70,000s appeared to flip into overhead resistance, while price pressed toward the next visible demand band on the right axis near the low $60,000s.
Momentum signals confirmed stress conditions. The 14 day RSI dropped to about 24, pushing deep into oversold territory on this view.
Volume also expanded during the selloff, which matched the sharp sequence of red candles into early February.
Even so, the rebound off $59,930 showed buyers stepping in at the extremes, although price still closed far below the broken structure lines that defined the earlier range.
Bitcoin liquidations spike as price slides toward $60K on Binance
Bitcoin’s sharp selloff over the past 24 hours triggered dense liquidation clusters on Binance, as shown by the BTC/USDT liquidation heatmap.
Price slid from the low $70,000s into the low $60,000s, with the deepest flush pushing toward the $60,000 area before buyers lifted price back toward the mid $60,000s.
The move unfolded in a steady sequence of lower highs and lower lows, which aligned with the broader downtrend seen on higher time frames.
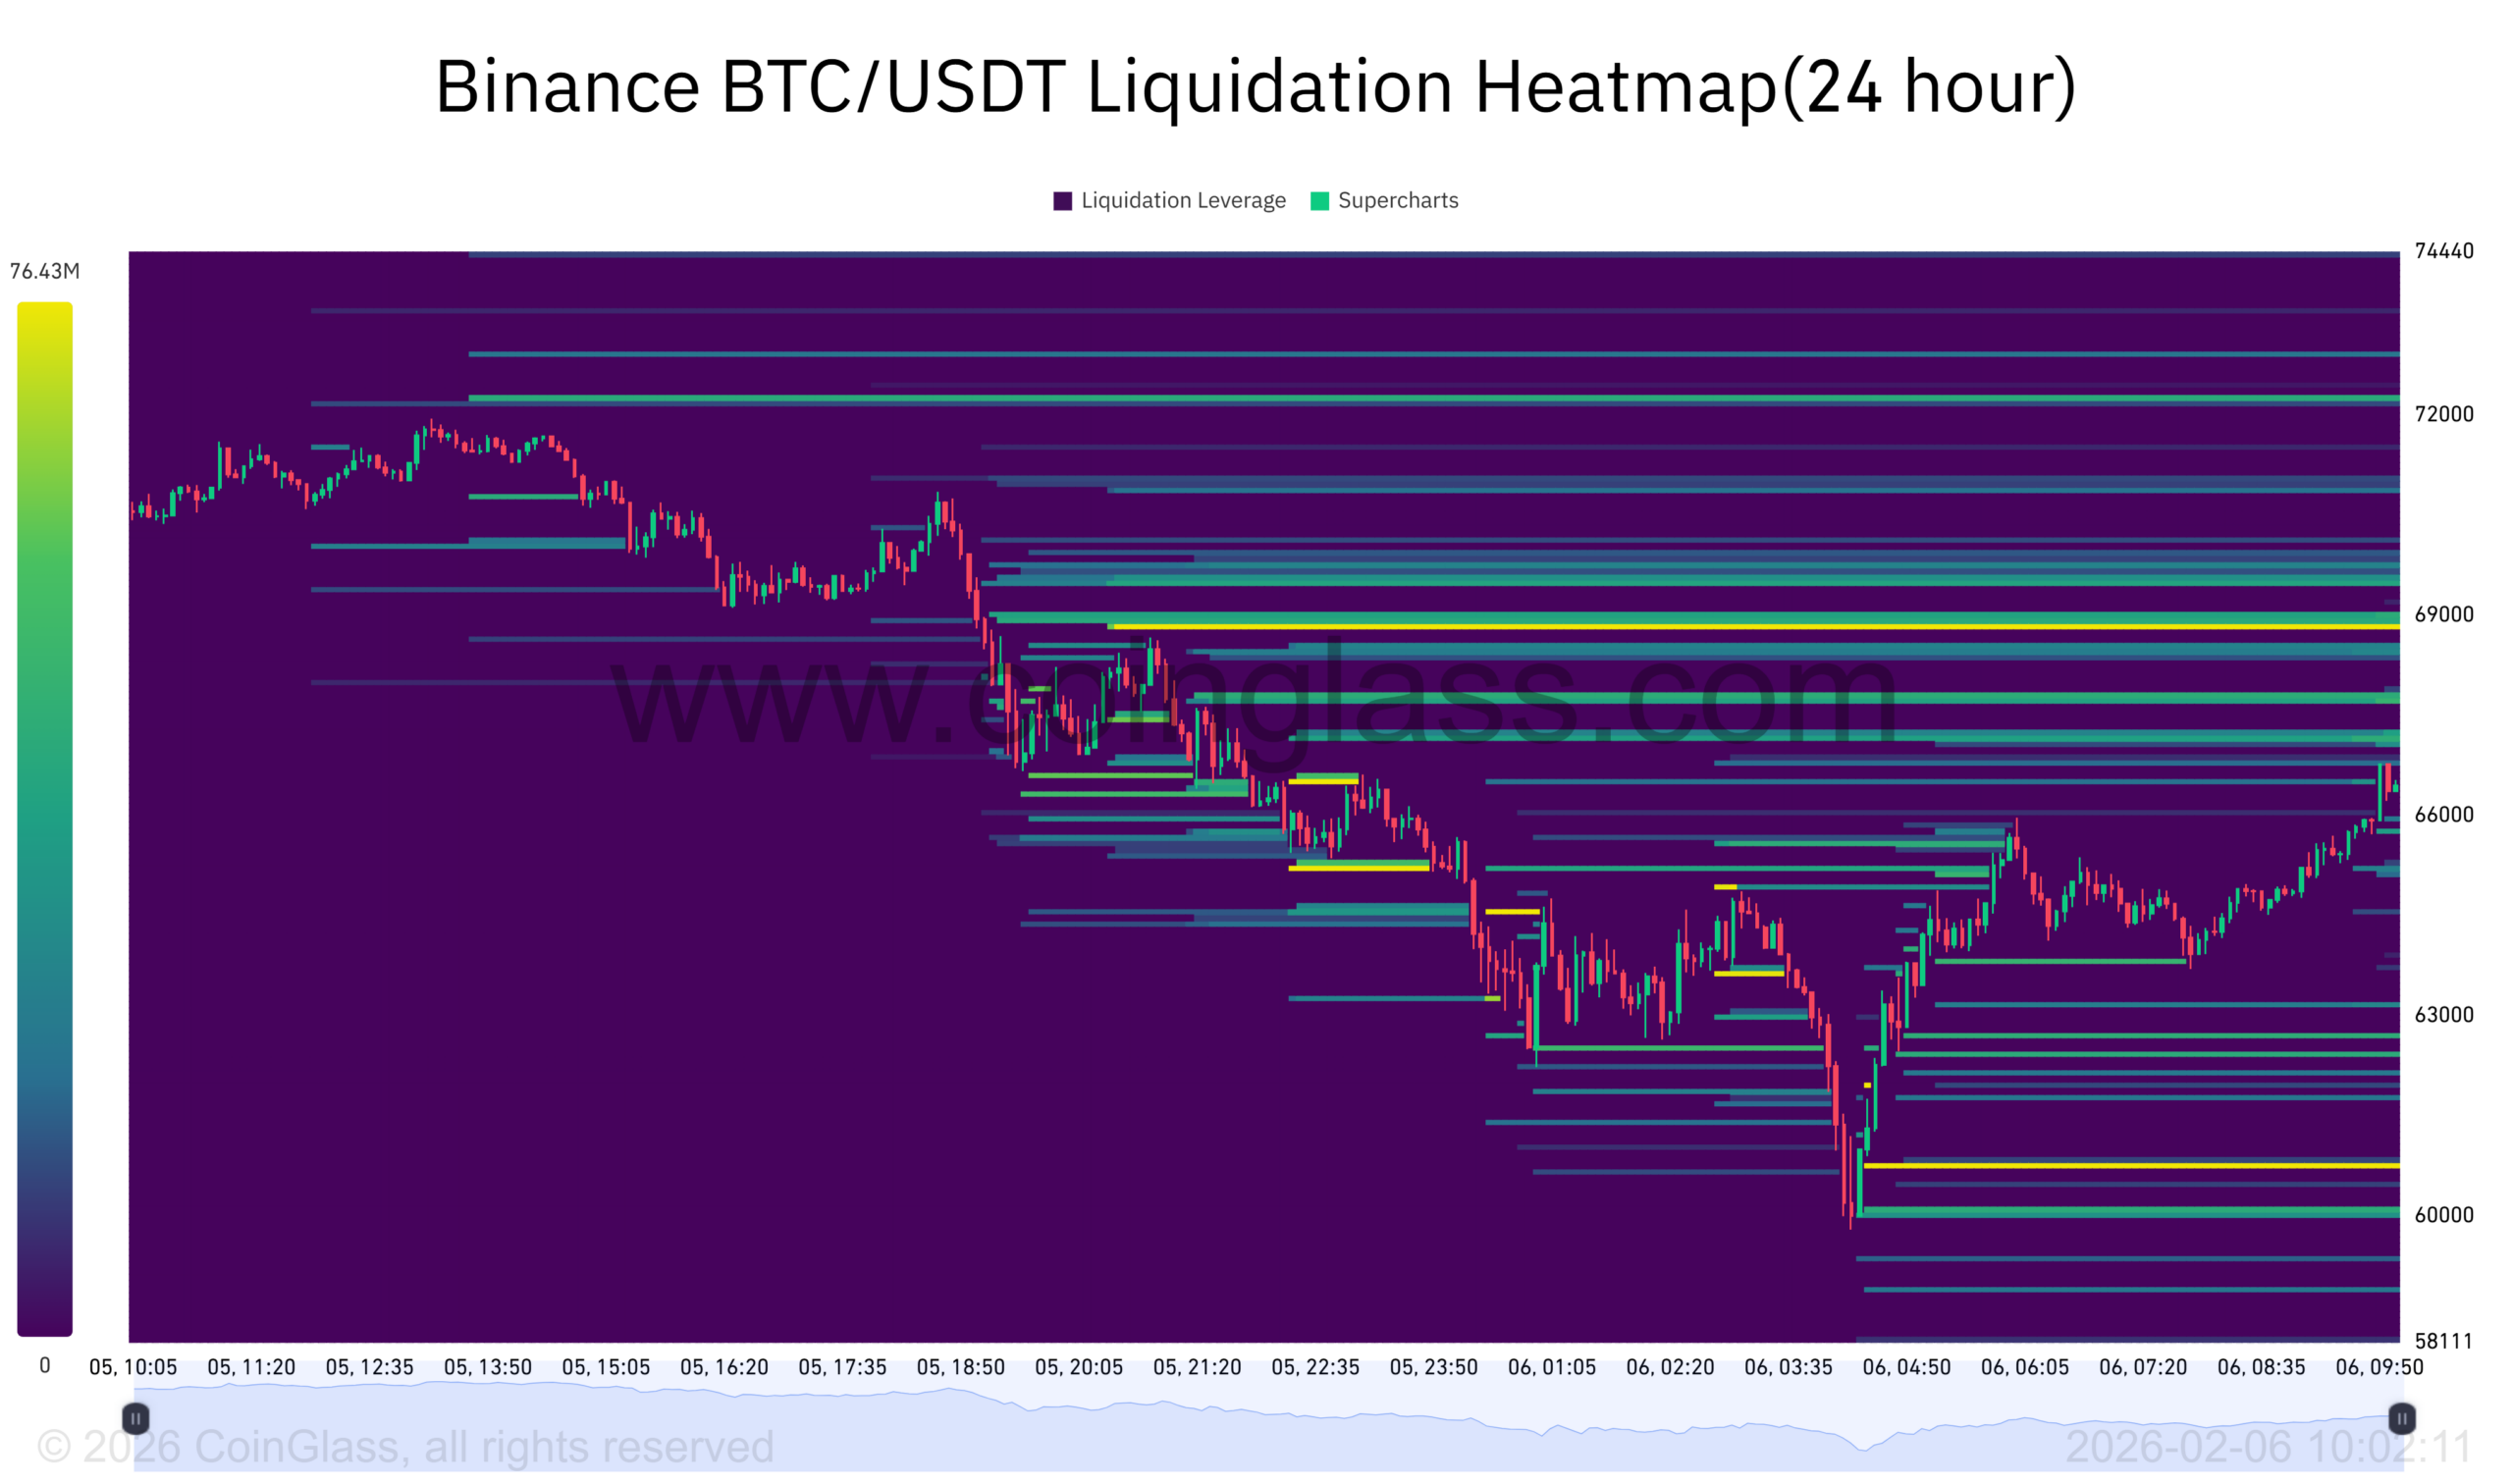
The heatmap highlights bright liquidation bands stacked around the $69,000 zone and again near the $60,000 area.
Those bands marked zones where leveraged long positions concentrated and then unwound as price moved through them.
As Bitcoin broke below the $69,000 region, forced closures accelerated the downside move, and price cascaded into the next dense pocket of liquidations closer to $60,000.
That flow explains the speed of the drop, since liquidation-driven selling adds market orders into already thin conditions.
Below the market, thinner but still visible liquidation layers appeared across the low $60,000s.
After price tagged the deepest cluster near $60,000, the sell pressure eased and short-term bids pushed price back toward the $65,000 to $66,000 area.
However, overhead liquidation bands remain concentrated between $66,000 and $69,000, which means any rebound runs into zones where trapped positions may still unwind as price revisits those levels.
Disclosure:This article does not contain investment advice or recommendations. Every investment and trading move involves risk, and readers should conduct their own research when making a decision.
Kriptoworld.com accepts no liability for any errors in the articles or for any financial loss resulting from incorrect information.

Tatevik Avetisyan is an editor at Kriptoworld who covers emerging crypto trends, blockchain innovation, and altcoin developments. She is passionate about breaking down complex stories for a global audience and making digital finance more accessible.
📅 Published: February 6, 2026 • 🕓 Last updated: February 6, 2026
