


A TradingView BTCUSD 4 hour chart from Bitstamp, timestamped Dec. 29, 2025 at 02:34 UTC minus 5, showed Bitcoin trading near $89,542 after a sharp bounce that pushed price back toward the $90,000 area.
The move followed a late December recovery that lifted candles off a rising support line, while price also pressed into a long, flat resistance band marked around the high $89,000s to roughly $90,000.
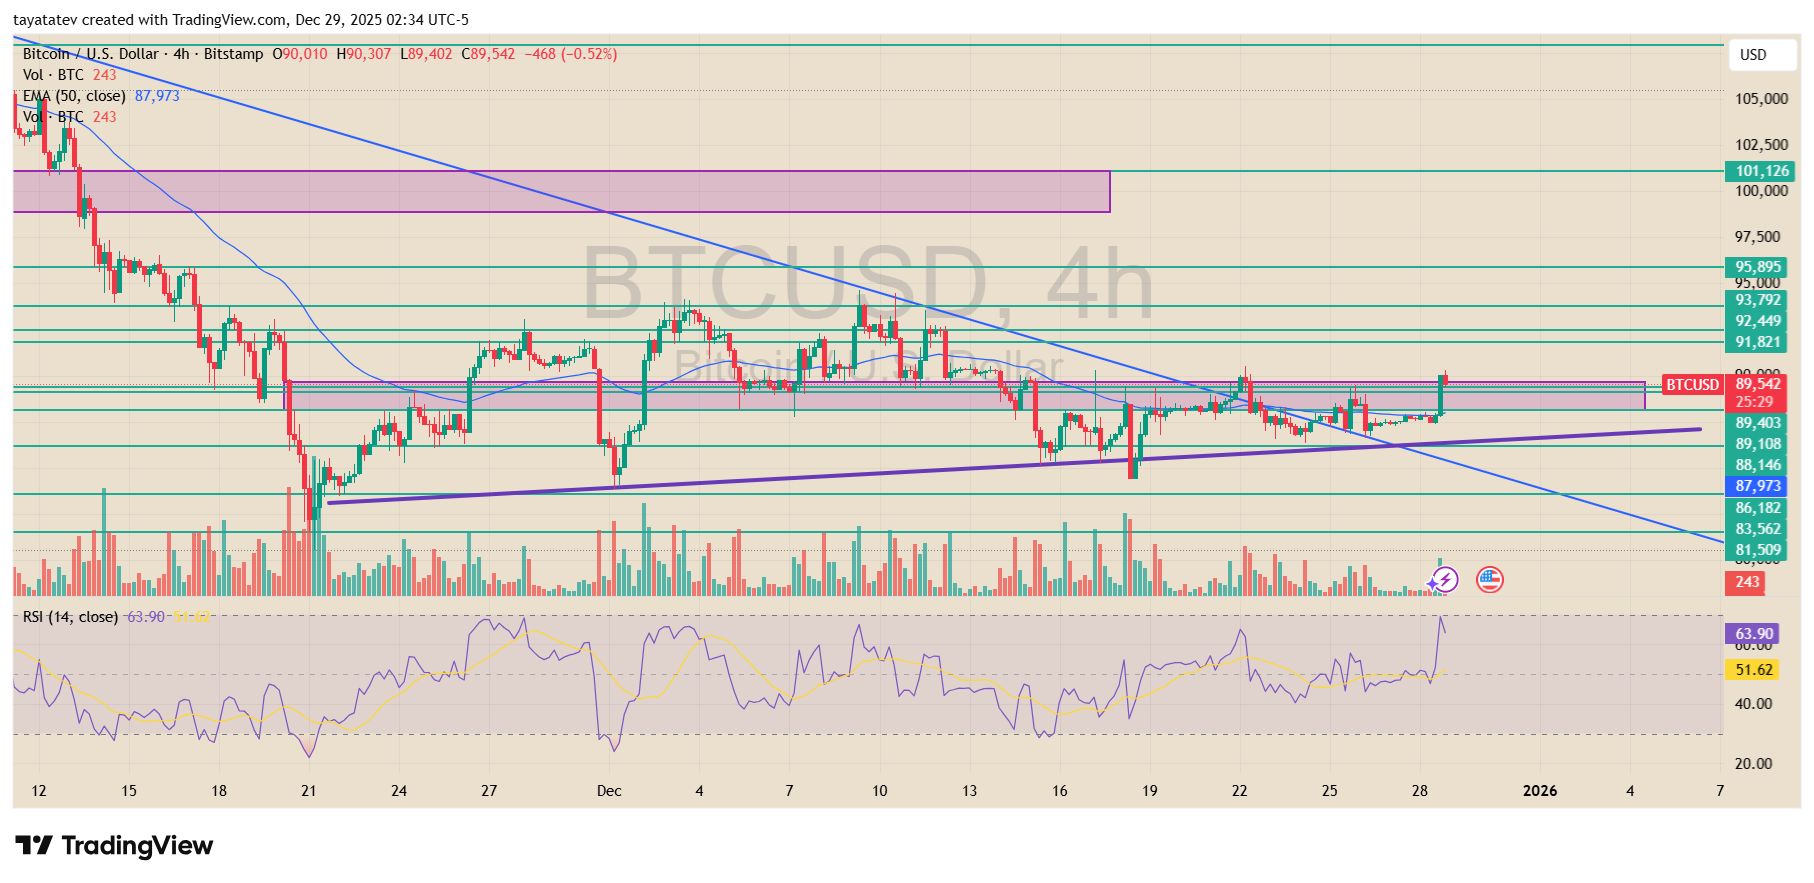
Price action on the chart framed that $90,000 zone as the near term pivot. Bitcoin repeatedly tapped this band through December, rejected, and then returned, which keeps it as the level traders will judge for acceptance or rejection.
This latest push arrived with a visible momentum pickup on the RSI panel, as RSI 14 read about 63.9, which showed stronger upside pressure than earlier in the month.
At the same time, the 50 period EMA sat near $87,973, and price remained above it, which kept the short term structure constructive as long as candles hold that trend filter.
The chart also mapped nearby upside checkpoints. After the $90,000 band, the next marked levels sat around $91,821 and $92,449, followed by $93,792 and $95,895.
Those lines created a ladder of resistance where failed breakouts could still pull price back into the same range.
However, if Bitcoin clears those steps and holds above them, the chart’s next highlighted target zone appeared near $101,126, which lined up with the upper resistance region drawn near $101,000.
Support sat just below the market in tight layers, so the chart also defined the downside if $90,000 continues to cap rallies.
The nearest marked supports clustered around $89,403 and $89,108, then $88,146 and the EMA area near $87,973.
A deeper pullback would put focus on $86,182 and $83,562, with $81,509 as the lowest labeled level in view.
In that setup, the uptrend case stays intact when Bitcoin defends the rising support and keeps reclaim attempts active at the $90,000 band, while the bearish case returns if repeated rejections force candles back under the EMA and into the lower support ladder.
Stay ahead in the crypto world – follow us on X for the latest updates, insights, and trends!🚀
Bitcoin holds a critical range as price consolidates into late December 2025
A TradingView Bitcoin Tether daily chart from KuCoin, created on Dec. 29, 2025 at 06:04 UTC plus 1, showed Bitcoin stabilizing inside a well defined horizontal range after a sharp late year selloff.
The chart highlighted a prolonged consolidation phase forming after price failed to hold above the October highs, shifting the market from trend continuation into range behavior.
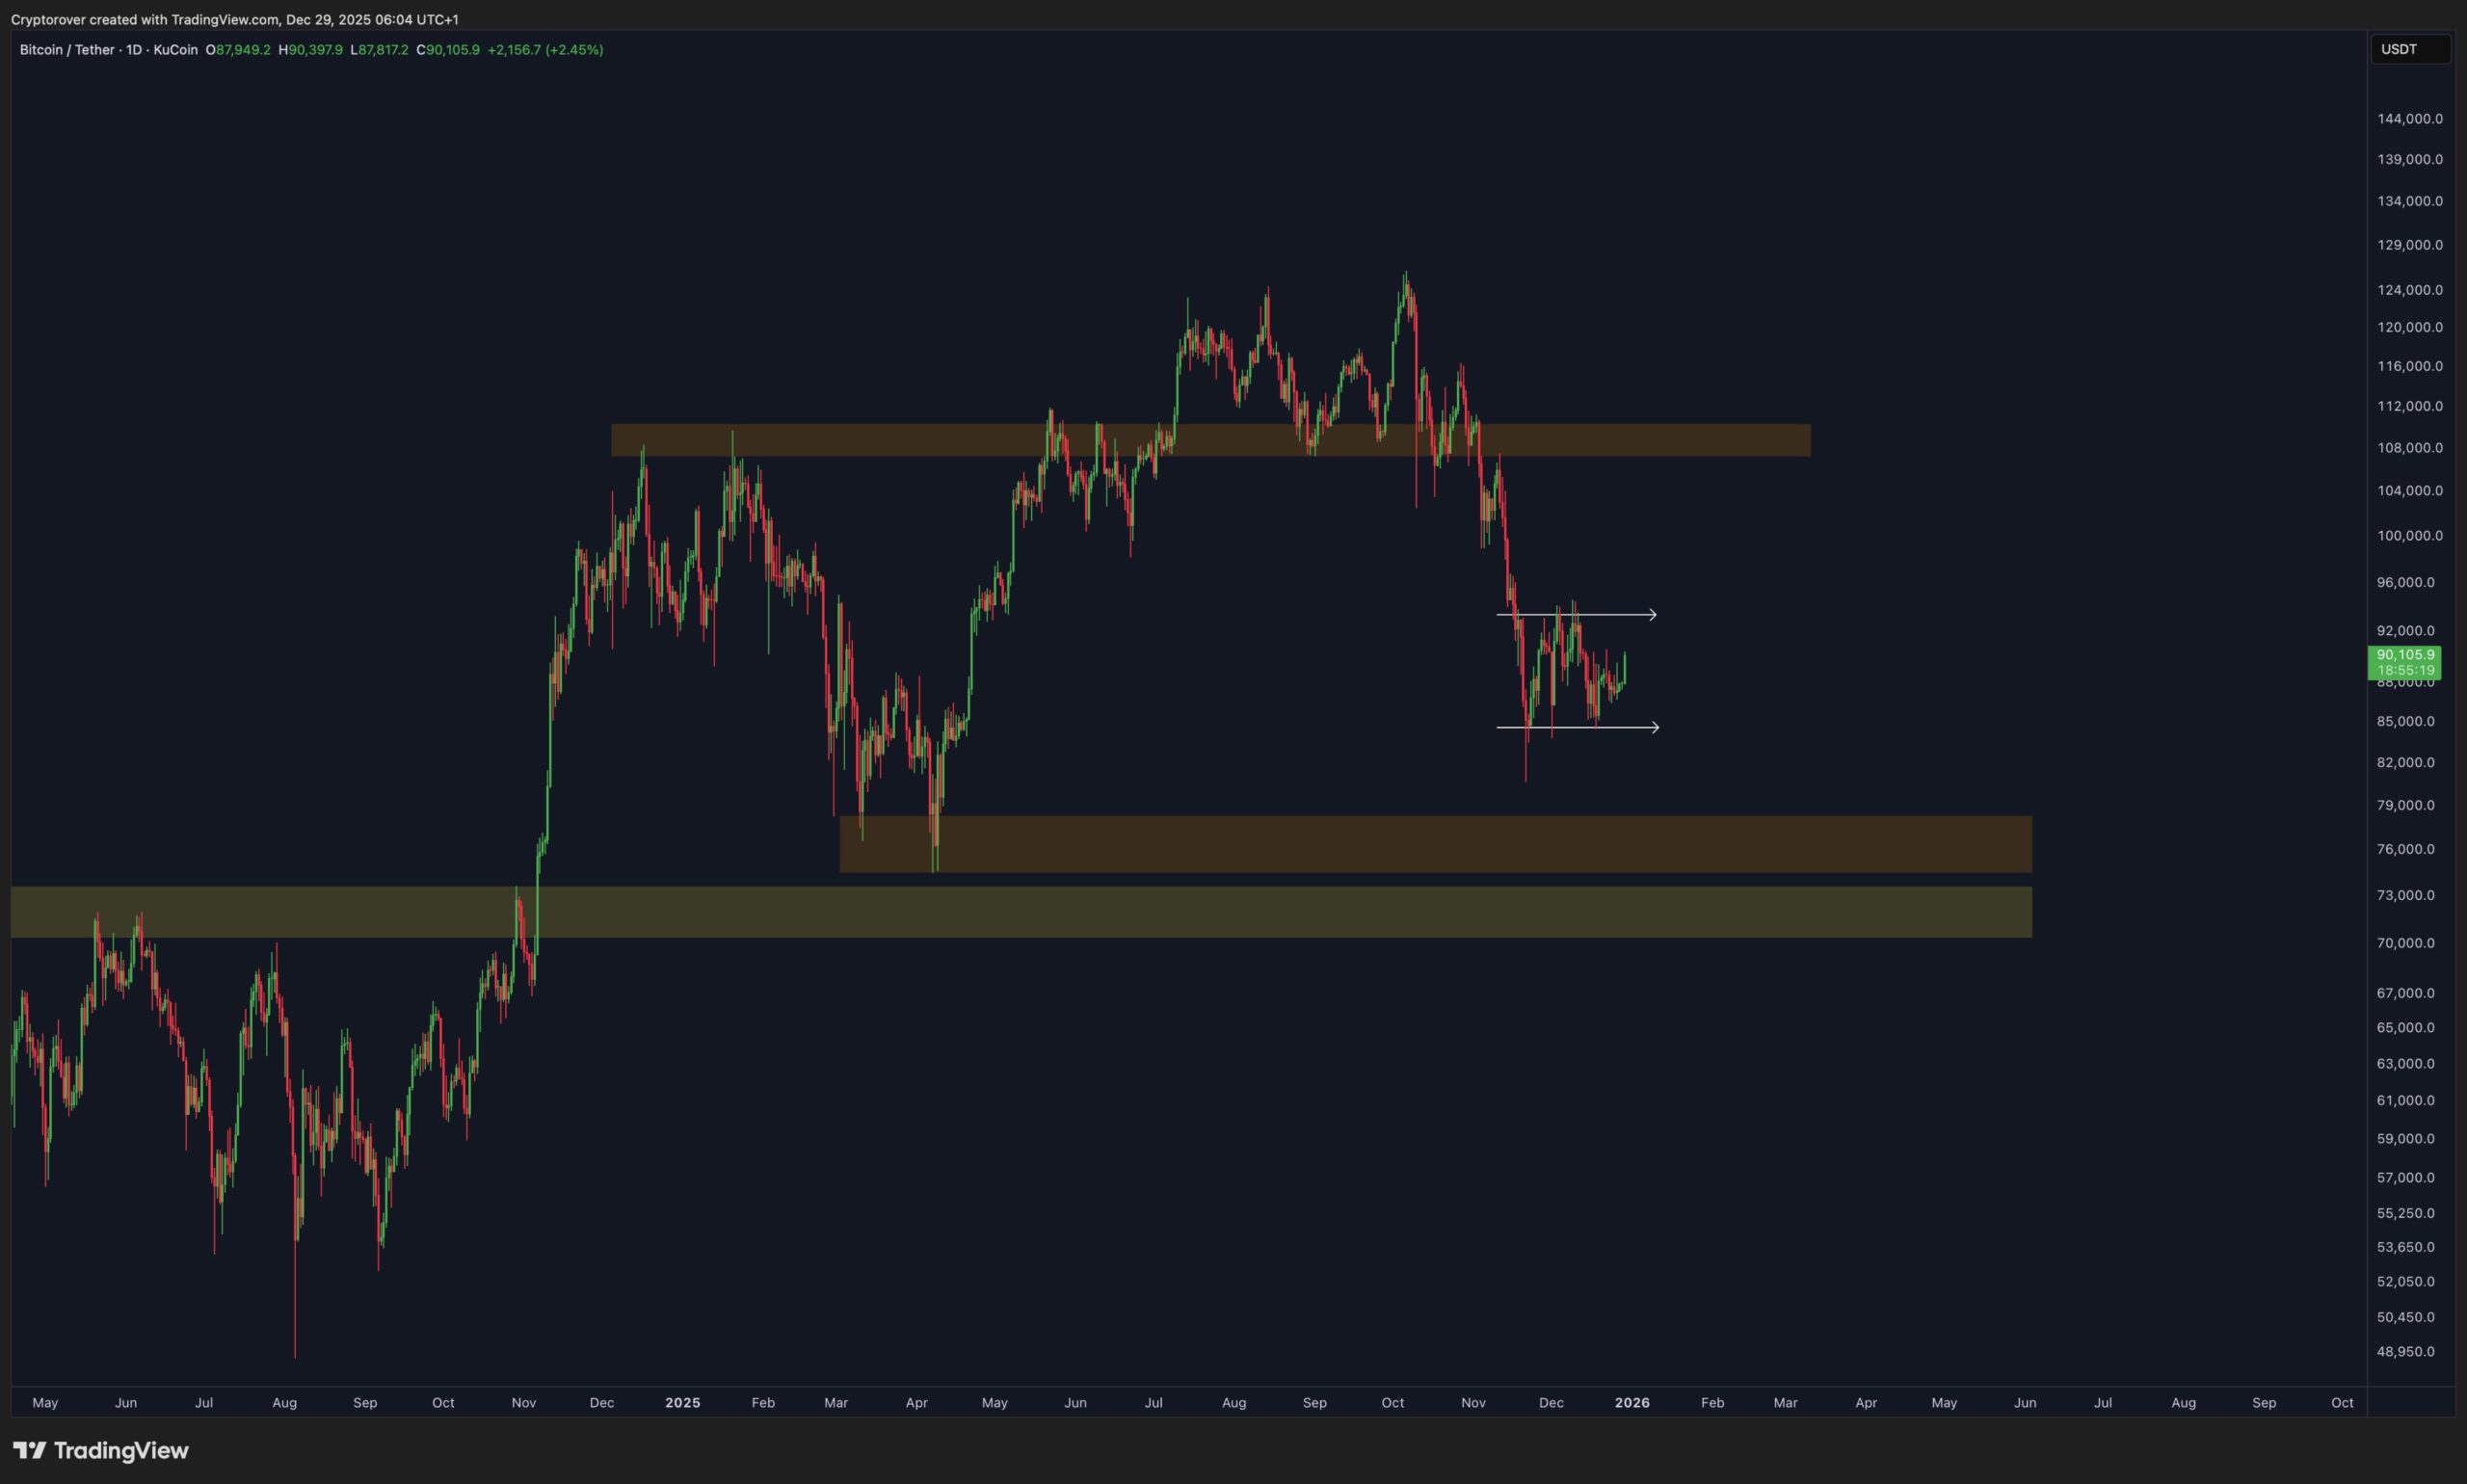
Price action showed repeated reactions at the same horizontal levels, which confirmed this area as a key decision zone.
The upper boundary formed in the low $90,000s, where multiple recovery attempts stalled and reversed.
At the same time, the lower boundary developed in the mid $80,000s, where sell pressure repeatedly slowed.
As a result, this band emerged as the most important range currently shaping Bitcoin’s structure.
The broader context reinforced the importance of this zone. Earlier in the year, Bitcoin struggled under a large resistance band around the $108,000 to $110,000 area before breaking lower.
That failure accelerated downside momentum and pushed price into the current consolidation.
Below the range, a wider demand zone between roughly $75,000 and $78,000 marked the base of the prior accumulation phase and remains the next major downside reference if support gives way.
Within the range, structure shifted from strong directional movement to compression. Swings tightened, and candles printed overlapping highs and lows, which reflected balance between buyers and sellers.
Higher lows appeared after the initial breakdown, which suggested that selling pressure weakened, but repeated failures near range resistance showed that buyers have not yet regained control.
As long as price remains inside this band, the chart framed the market as neutral, with the next sustained breakout or breakdown likely to define the next major move.
Disclosure:This article does not contain investment advice or recommendations. Every investment and trading move involves risk, and readers should conduct their own research when making a decision.
Kriptoworld.com accepts no liability for any errors in the articles or for any financial loss resulting from incorrect information.

Tatevik Avetisyan is an editor at Kriptoworld who covers emerging crypto trends, blockchain innovation, and altcoin developments. She is passionate about breaking down complex stories for a global audience and making digital finance more accessible.
📅 Published: December 29, 2025 • 🕓 Last updated: December 29, 2025
