


Bitcoin traded near $66,505 on the 15-minute BTCUSD index chart as price continued to slide within a descending channel.
The move followed a failed bounce from the upper channel line, which kept short-term pressure pointed lower.
Stay ahead in the crypto world – follow us on X for the latest updates, insights, and trends!🚀
As a result, price drifted back toward the lower boundary of the structure, where recent reactions clustered.
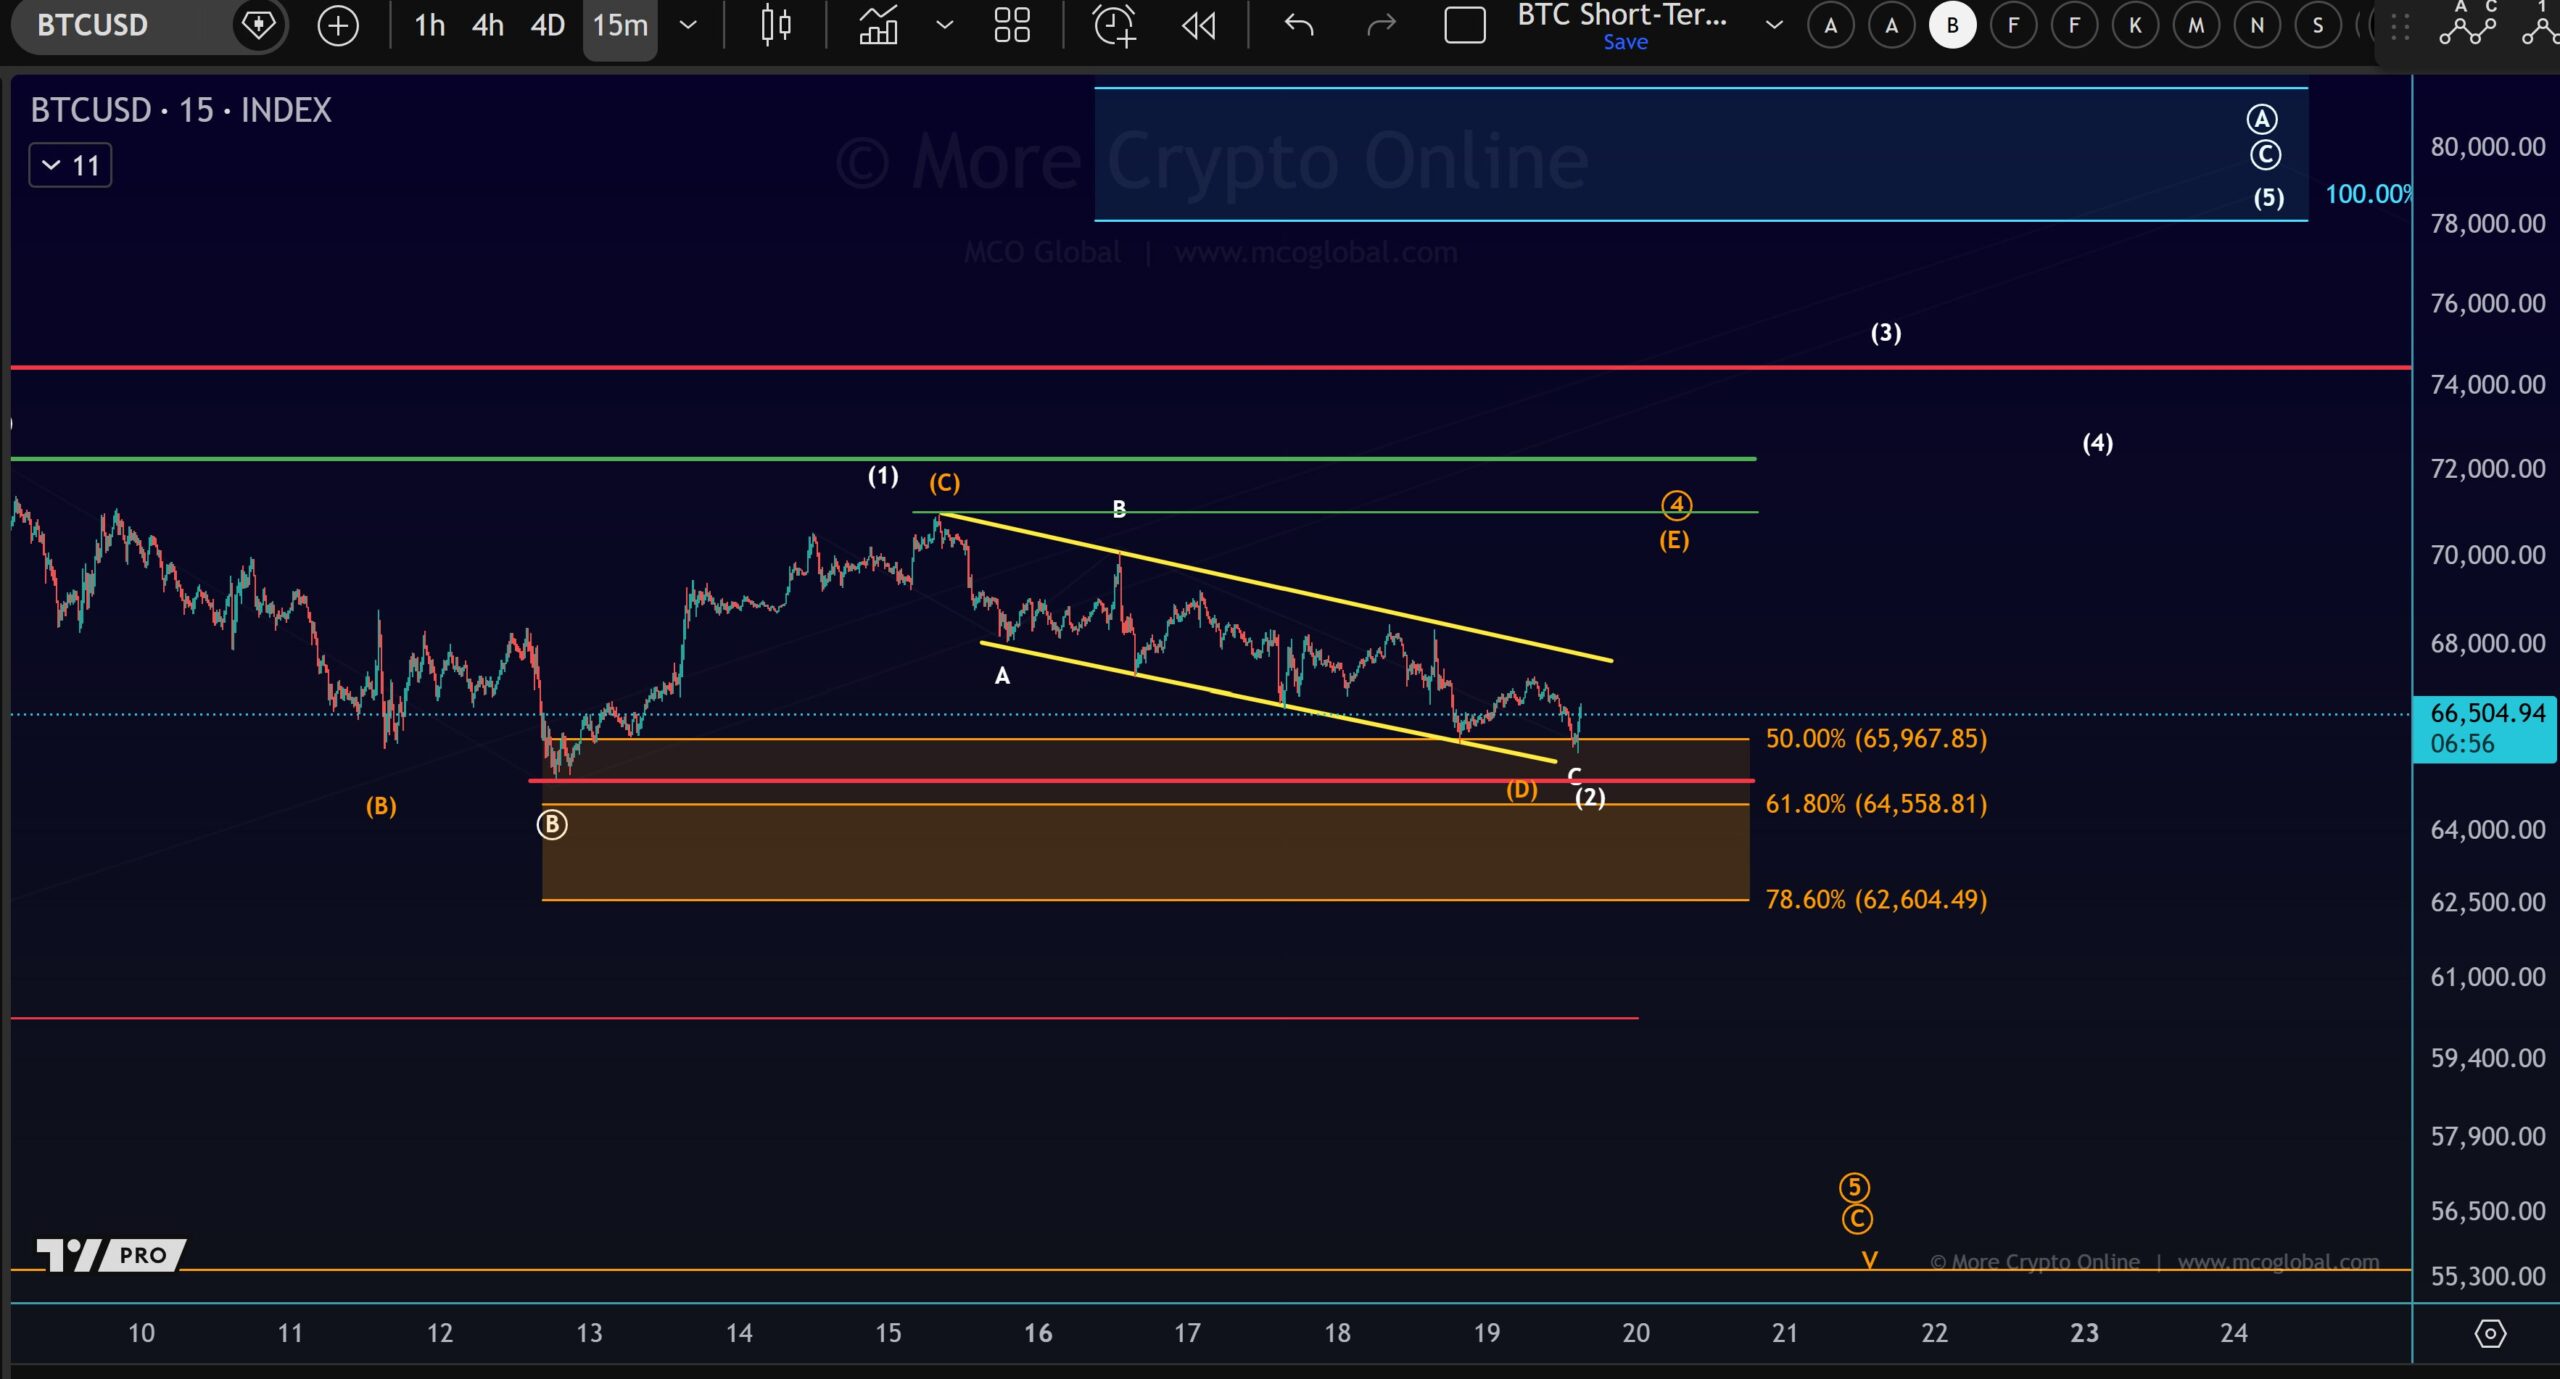
The chart marked a key support band between roughly $62,600 and $65,900, defined by the 78.6% and 50% Fibonacci retracement levels from the prior swing. Price recently tapped the lower channel edge near the 61.8% retracement around $64,559, then stalled.
This area has acted as a reaction zone across several intraday tests. However, the structure still shows lower highs and lower lows, which keeps the near-term bias weak while price remains capped below the channel midline.
More Crypto Online said it cannot rule out a deeper test of the broader support zone around $55,000 to $56,000. That zone aligns with a prior demand area marked on the chart and sits below the current Fibonacci pocket.
Therefore, if price fails to hold the current retracement band, the next visible liquidity area sits lower, near the mid-$50,000s.
Conversely, a hold above the lower channel line could allow a short-term rebound toward the upper boundary near the low-$70,000s, where prior resistance and retracement levels converge.
IncomeSharks Flags Higher Time Frame Plan as Bitcoin Trades Under Downtrend Line
IncomeSharks argued that traders may only need “a few Bitcoin charts” for the year, because lower time frames add noise and trigger impulsive decisions.
He said traders should build a plan, follow it, and then adjust only when higher time frame invalidation or fresh data forces a change.
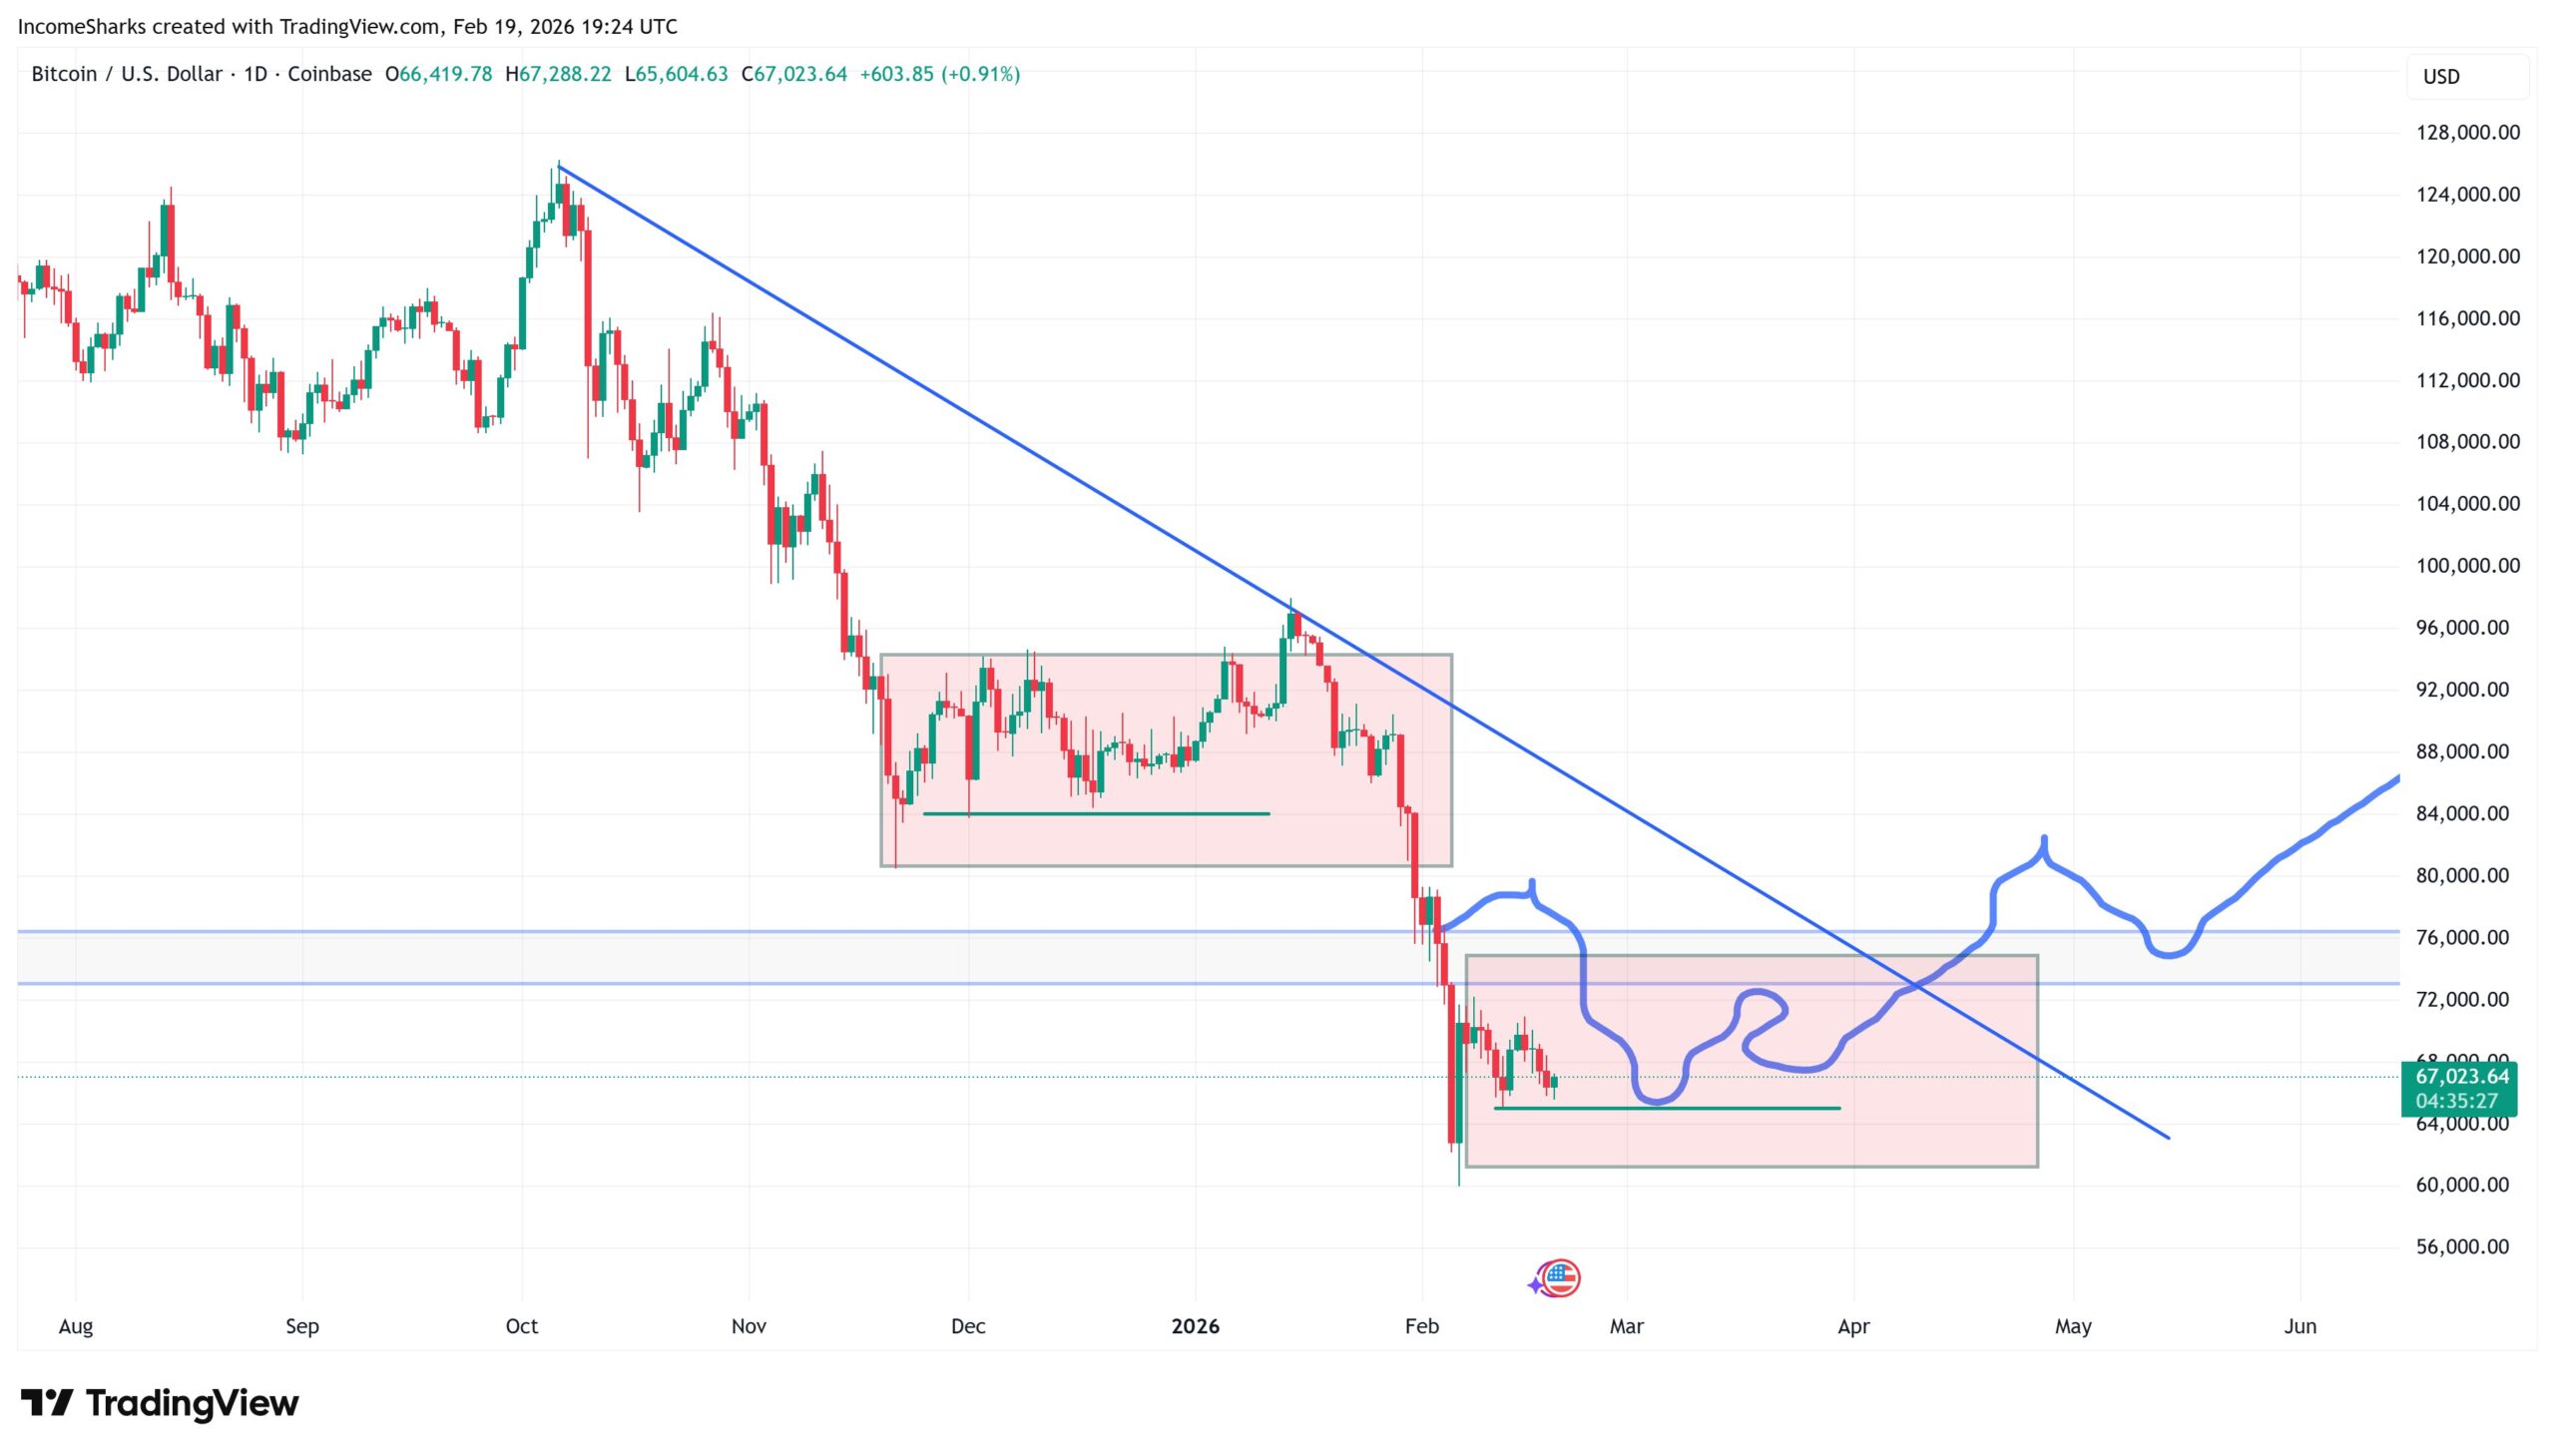
The shared chart showed Bitcoin on a daily BTCUSD view from Coinbase, with a long, descending trendline stretching from the prior peak into 2026.
Price action broke down through a previous consolidation range highlighted in a large shaded box, and then dropped into a lower shaded zone that the chart framed as a potential basing area.
The drawing also mapped a possible path that first chops inside that lower zone, then lifts into a mid-range resistance area, and later pushes higher while the downtrend line loses control.
The message stayed the same across the setup: focus on the big structure, treat the shaded zones and the trendline as decision points, and avoid reacting to intraday swings that do not change the larger picture.
Disclosure:This article does not contain investment advice or recommendations. Every investment and trading move involves risk, and readers should conduct their own research when making a decision.
Kriptoworld.com accepts no liability for any errors in the articles or for any financial loss resulting from incorrect information.

Tatevik Avetisyan is an editor at Kriptoworld who covers emerging crypto trends, blockchain innovation, and altcoin developments. She is passionate about breaking down complex stories for a global audience and making digital finance more accessible.
📅 Published: February 20, 2026 • 🕓 Last updated: February 20, 2026
