


Shiba Inu (SHIB) is flashing a potential bullish reversal on November 17, 2025, as its daily chart carves out a falling-wedge pattern with easing downside momentum.
Now the setup points to a possible breakout that could extend gains toward 58 percent and even 71 percent above the current price if buyers confirm the move.
Stay ahead in the crypto world – follow us on X for the latest updates, insights, and trends!🚀
SHIB Forms Falling Wedge as Breakout Targets Up to 71 Percent Gain
Shiba Inu (SHIB) printed a falling-wedge pattern on November 17, 2025, as the daily chart shows price compressing between two downward-sloping trendlines.
The structure formed after months of steady lower highs and lower lows. In technical analysis, a falling wedge signals weakening bearish momentum and often precedes a bullish breakout when buyers push the price above the upper boundary.
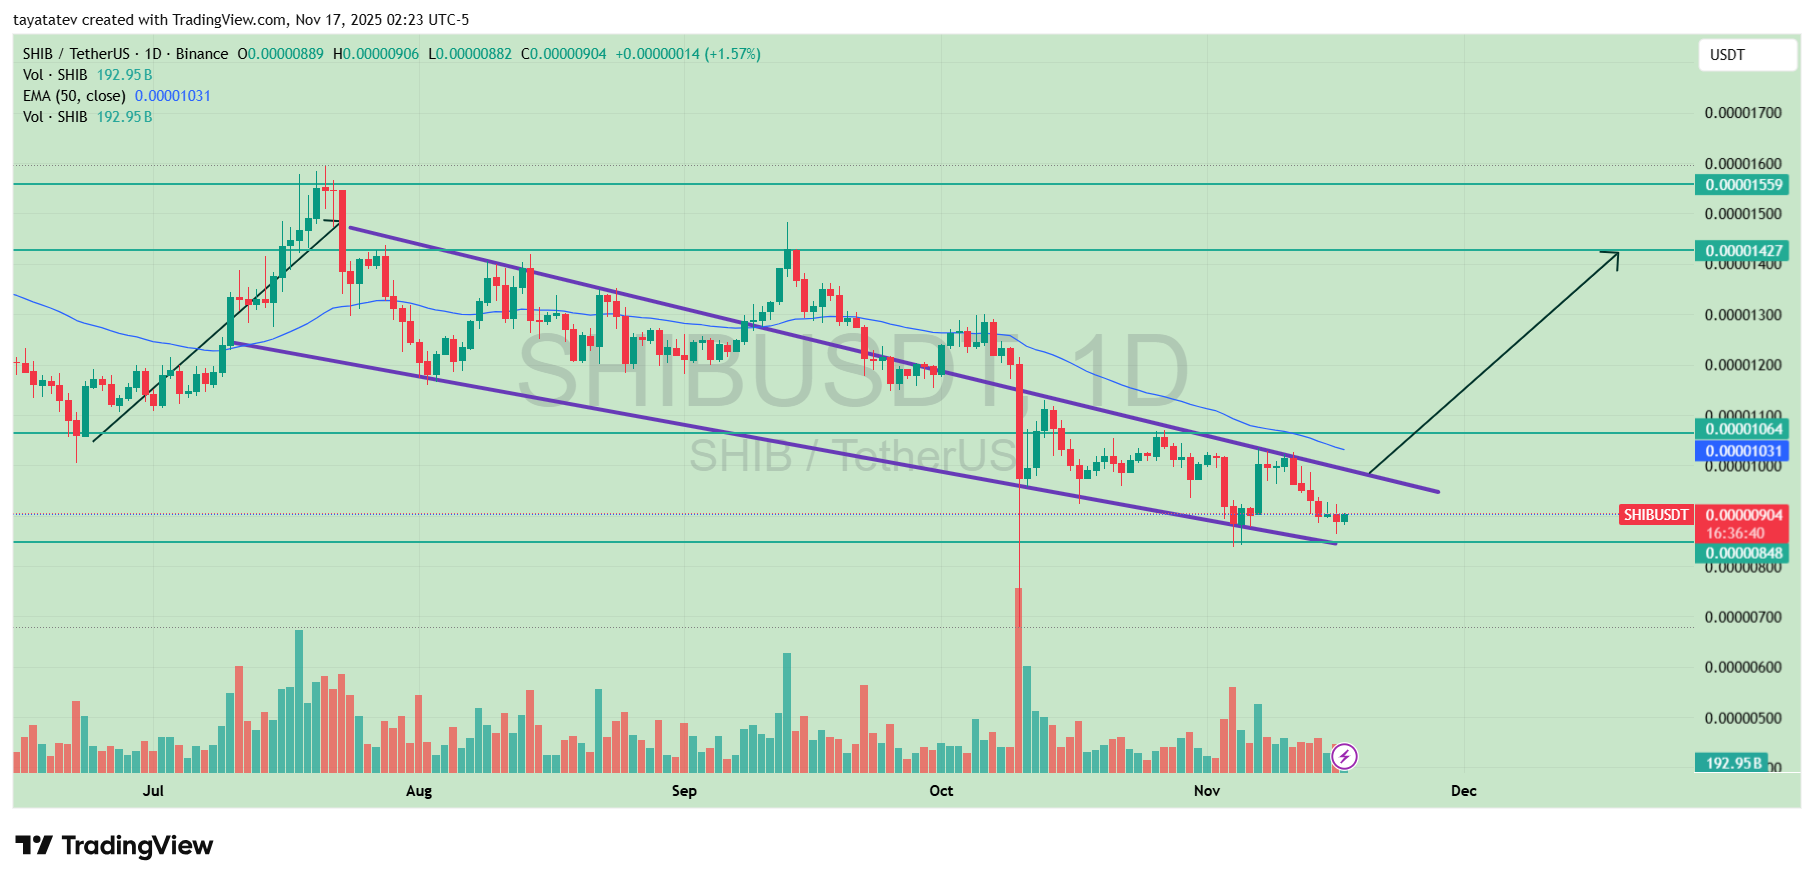
The chart shows SHIB trading near 0.00000904 while sitting at the wedge’s lower support zone.
The upper boundary of the wedge aligns with the 50-day exponential moving average near 0.00001031, creating a key first test for any breakout attempt.
As price approaches the apex, the narrowing distance between highs and lows indicates reduced seller strength and greater odds of a reversal.
If SHIB confirms a break above the wedge’s upper trendline, the pattern’s measured move projects a 58 percent rise from the current level toward the 0.00001427 resistance.
This level previously acted as a consolidation zone in September and remains a major liquidity cluster on the chart.
A daily close above 0.00001064 would strengthen the breakout and validate the pattern’s first upside target.
After that zone, the chart outlines a secondary objective. A full falling-wedge extension places the next resistance near 0.00001559, about 71 percent above today’s price.
This level aligns with the top of a prior distribution range and marks a technical barrier where SHIB rejected multiple times in July.
SHIB continues to trade inside the wedge for now, but the structure shows a clear bullish setup if confirmation appears with strong volume above the upper trendline.
MACD Signals Bearish Momentum Is Fading for SHIB
On November 17, 2025, Shiba Inu’s daily MACD shows selling pressure easing as momentum starts to turn.
The histogram has flipped from deep red bars to small green ones around the zero line, which signals that the recent downside wave is losing strength.
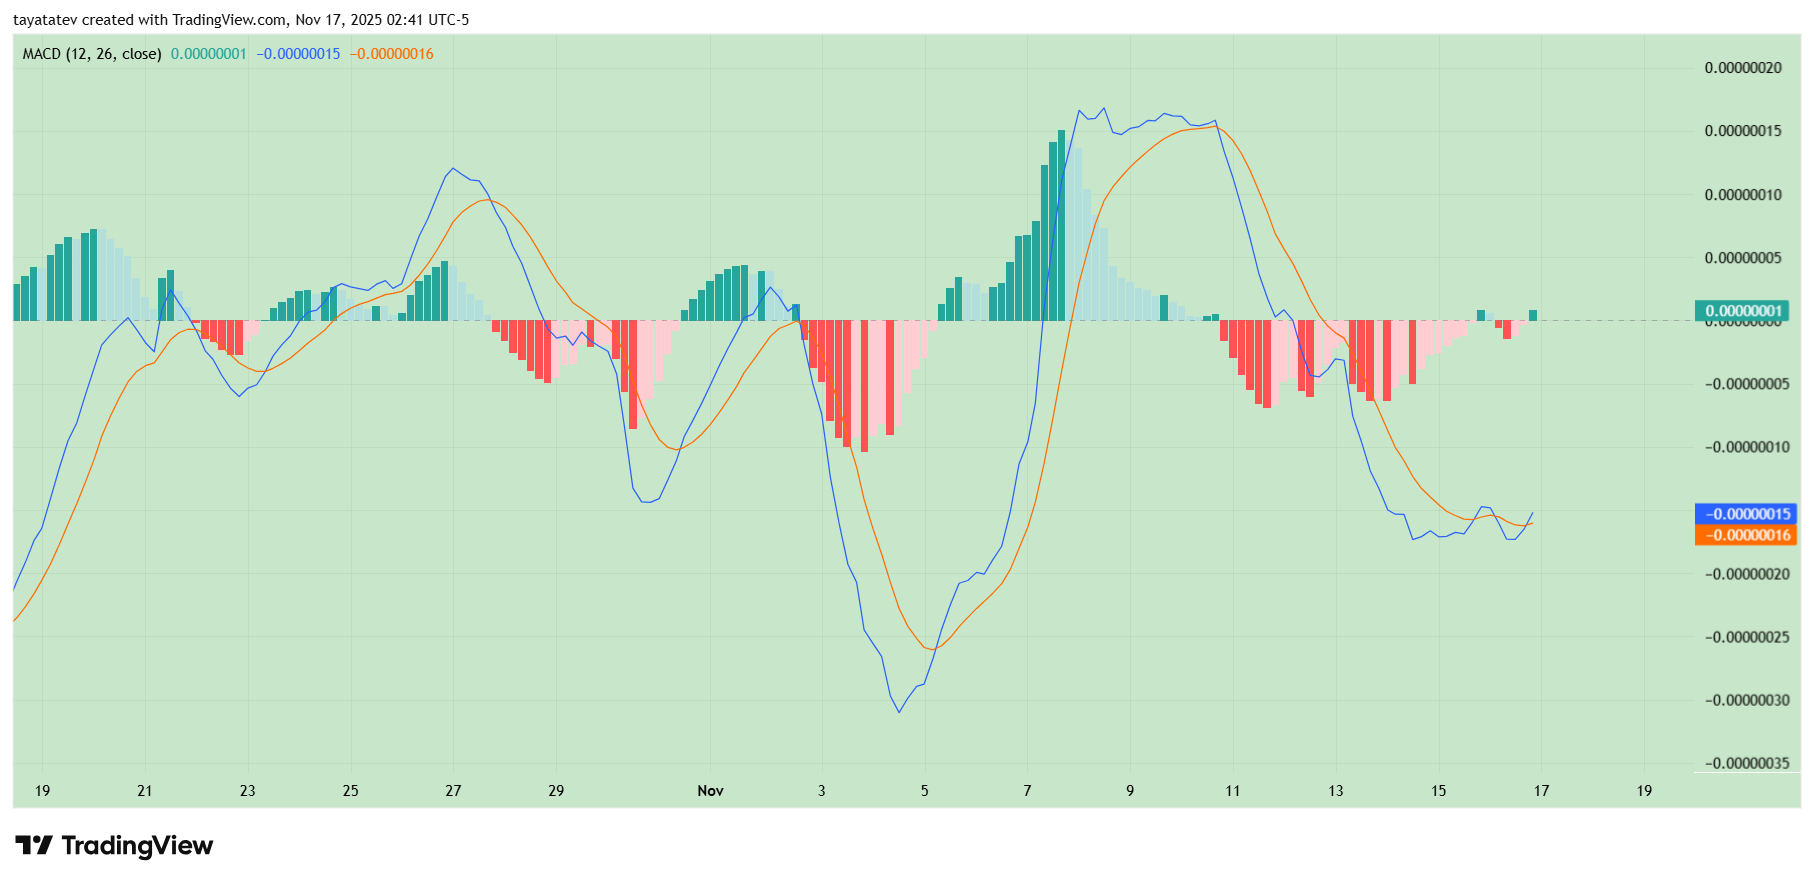
At the same time, the MACD line is curling upward from oversold territory and moving closer to the signal line.
This behavior usually appears late in a downtrend, when sellers no longer push price lower with the same force and buyers begin to test the move.
If the MACD line crosses above the signal line and both continue rising toward the zero level, it would confirm a bullish momentum shift that supports the falling-wedge breakout case on the price chart.
Until then, the indicator points to a market that is still weak but increasingly balanced, with momentum slowly tilting back toward the upside.
Disclosure:This article does not contain investment advice or recommendations. Every investment and trading move involves risk, and readers should conduct their own research when making a decision.
Kriptoworld.com accepts no liability for any errors in the articles or for any financial loss resulting from incorrect information.

Tatevik Avetisyan is an editor at Kriptoworld who covers emerging crypto trends, blockchain innovation, and altcoin developments. She is passionate about breaking down complex stories for a global audience and making digital finance more accessible.
📅 Published: November 17, 2025 • 🕓 Last updated: November 17, 2025
