


On Jan. 9, 2026, the Cardano to U.S. dollar weekly chart on Coinbase showed ADA trading near $0.40, after weeks of controlled downside inside a narrowing structure.
The chart, created on TradingView, highlights a bullish flag pattern developing after the sharp rally seen in late 2024, followed by a steady pullback through 2025.
Stay ahead in the crypto world – follow us on X for the latest updates, insights, and trends!🚀
Since then, price has continued to compress while respecting parallel trendlines, signaling a pause rather than a trend break.
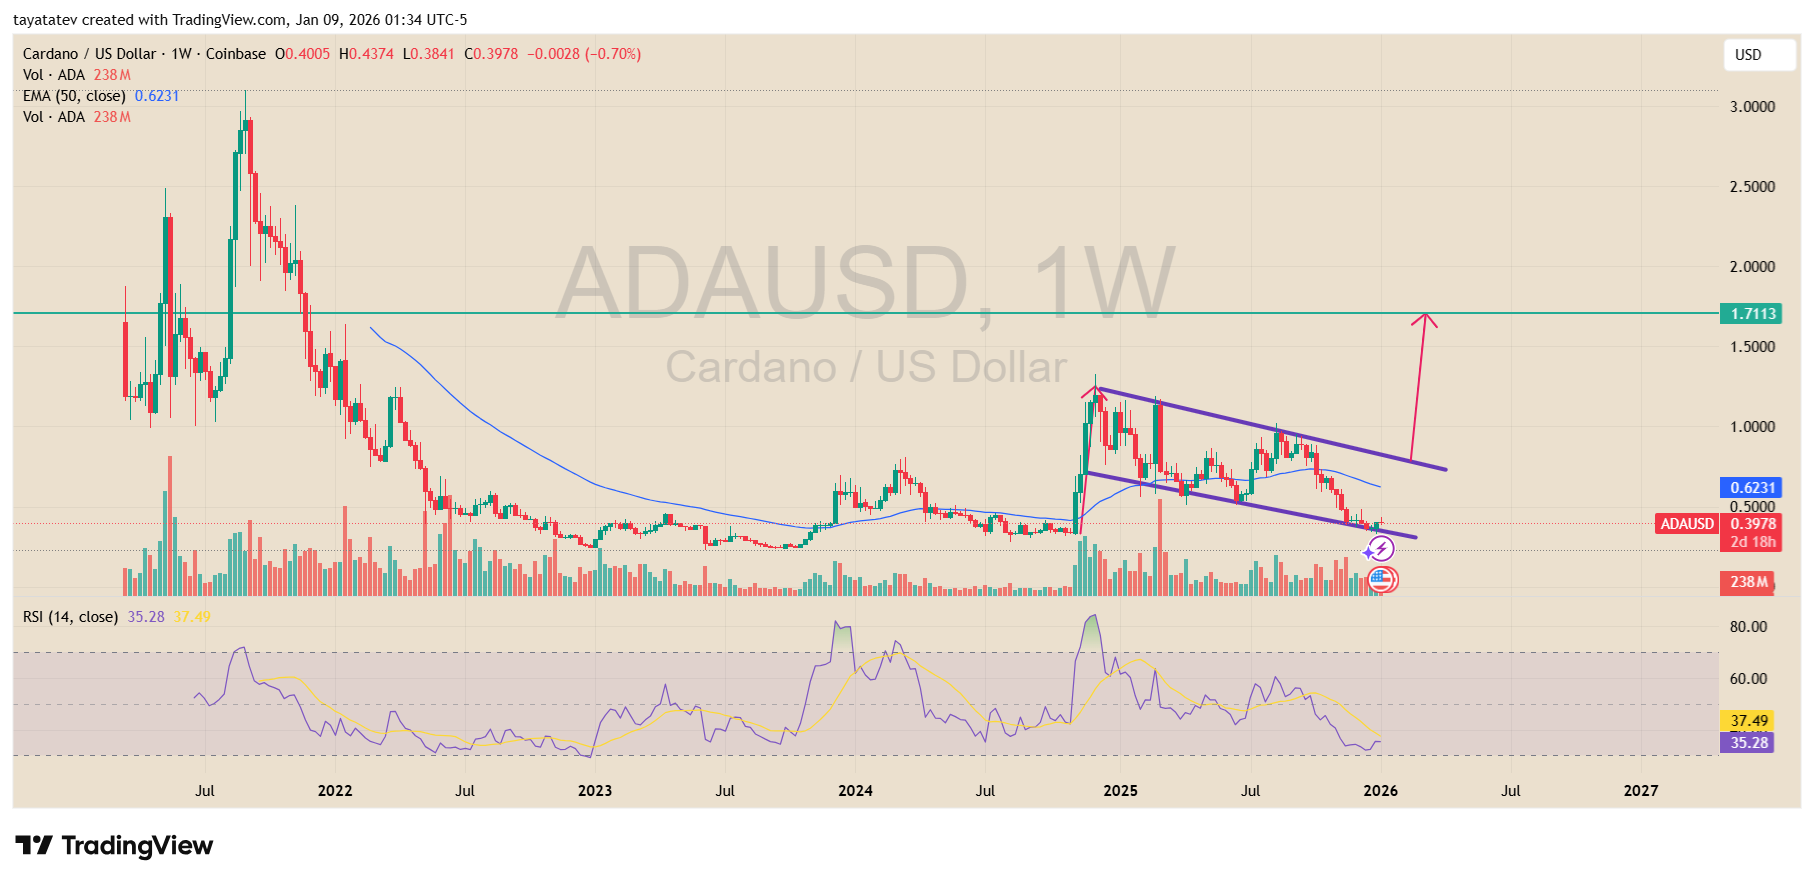
A bullish flag pattern forms when price consolidates in a downward sloping channel after a strong upward move, often acting as a continuation setup.
In this case, ADA’s prior impulse leg started from the 2023 lows and peaked near the $1.30 area in early 2025. The current pullback remains orderly, with no structural breakdown on the weekly timeframe.
Price now trades well below the 50 week exponential moving average, which sits near $0.62. However, the EMA continues to act as the main confirmation level.
If ADA reclaims and holds above the 50 week EMA, the flag structure would shift toward confirmation rather than consolidation. That move would signal that buyers have regained control of the broader trend.
The projected upside target from the bullish flag aligns near the $1.70 zone, marked by prior horizontal resistance. From the current price around $0.40, a move to that level would represent roughly a 320 percent advance. This target also lines up with the upper resistance band drawn across the chart, strengthening its technical relevance.
Momentum indicators support the consolidation narrative rather than breakdown risk.
The weekly RSI remains near the mid 30s, reflecting cooling momentum after the prior rally but not showing extreme weakness.
Volume has also declined during the pullback, which fits a flag structure where participation pauses before a potential continuation move.
Until price reclaims the 50 week EMA, the setup remains conditional rather than confirmed. Still, the structure shows ADA compressing at long term support, with trend context favoring continuation if a weekly close above the EMA occurs.
Cardano Holds Multi Year Triangle as Price Sits on High Timeframe Demand
On Jan. 8, 2026, the ADAUSDT 2 week chart on Binance showed Cardano trading near $0.39, after slipping back into a long running demand area that the chart marks between about $0.38 and $0.28.
Price also sat on a rising macro trendline that has supported the market since the 2020 to 2021 cycle, while the long term downtrend from the 2021 peak continued to press from above.
That mix leaves ADA in a compression phase, where the next clean break often decides direction.
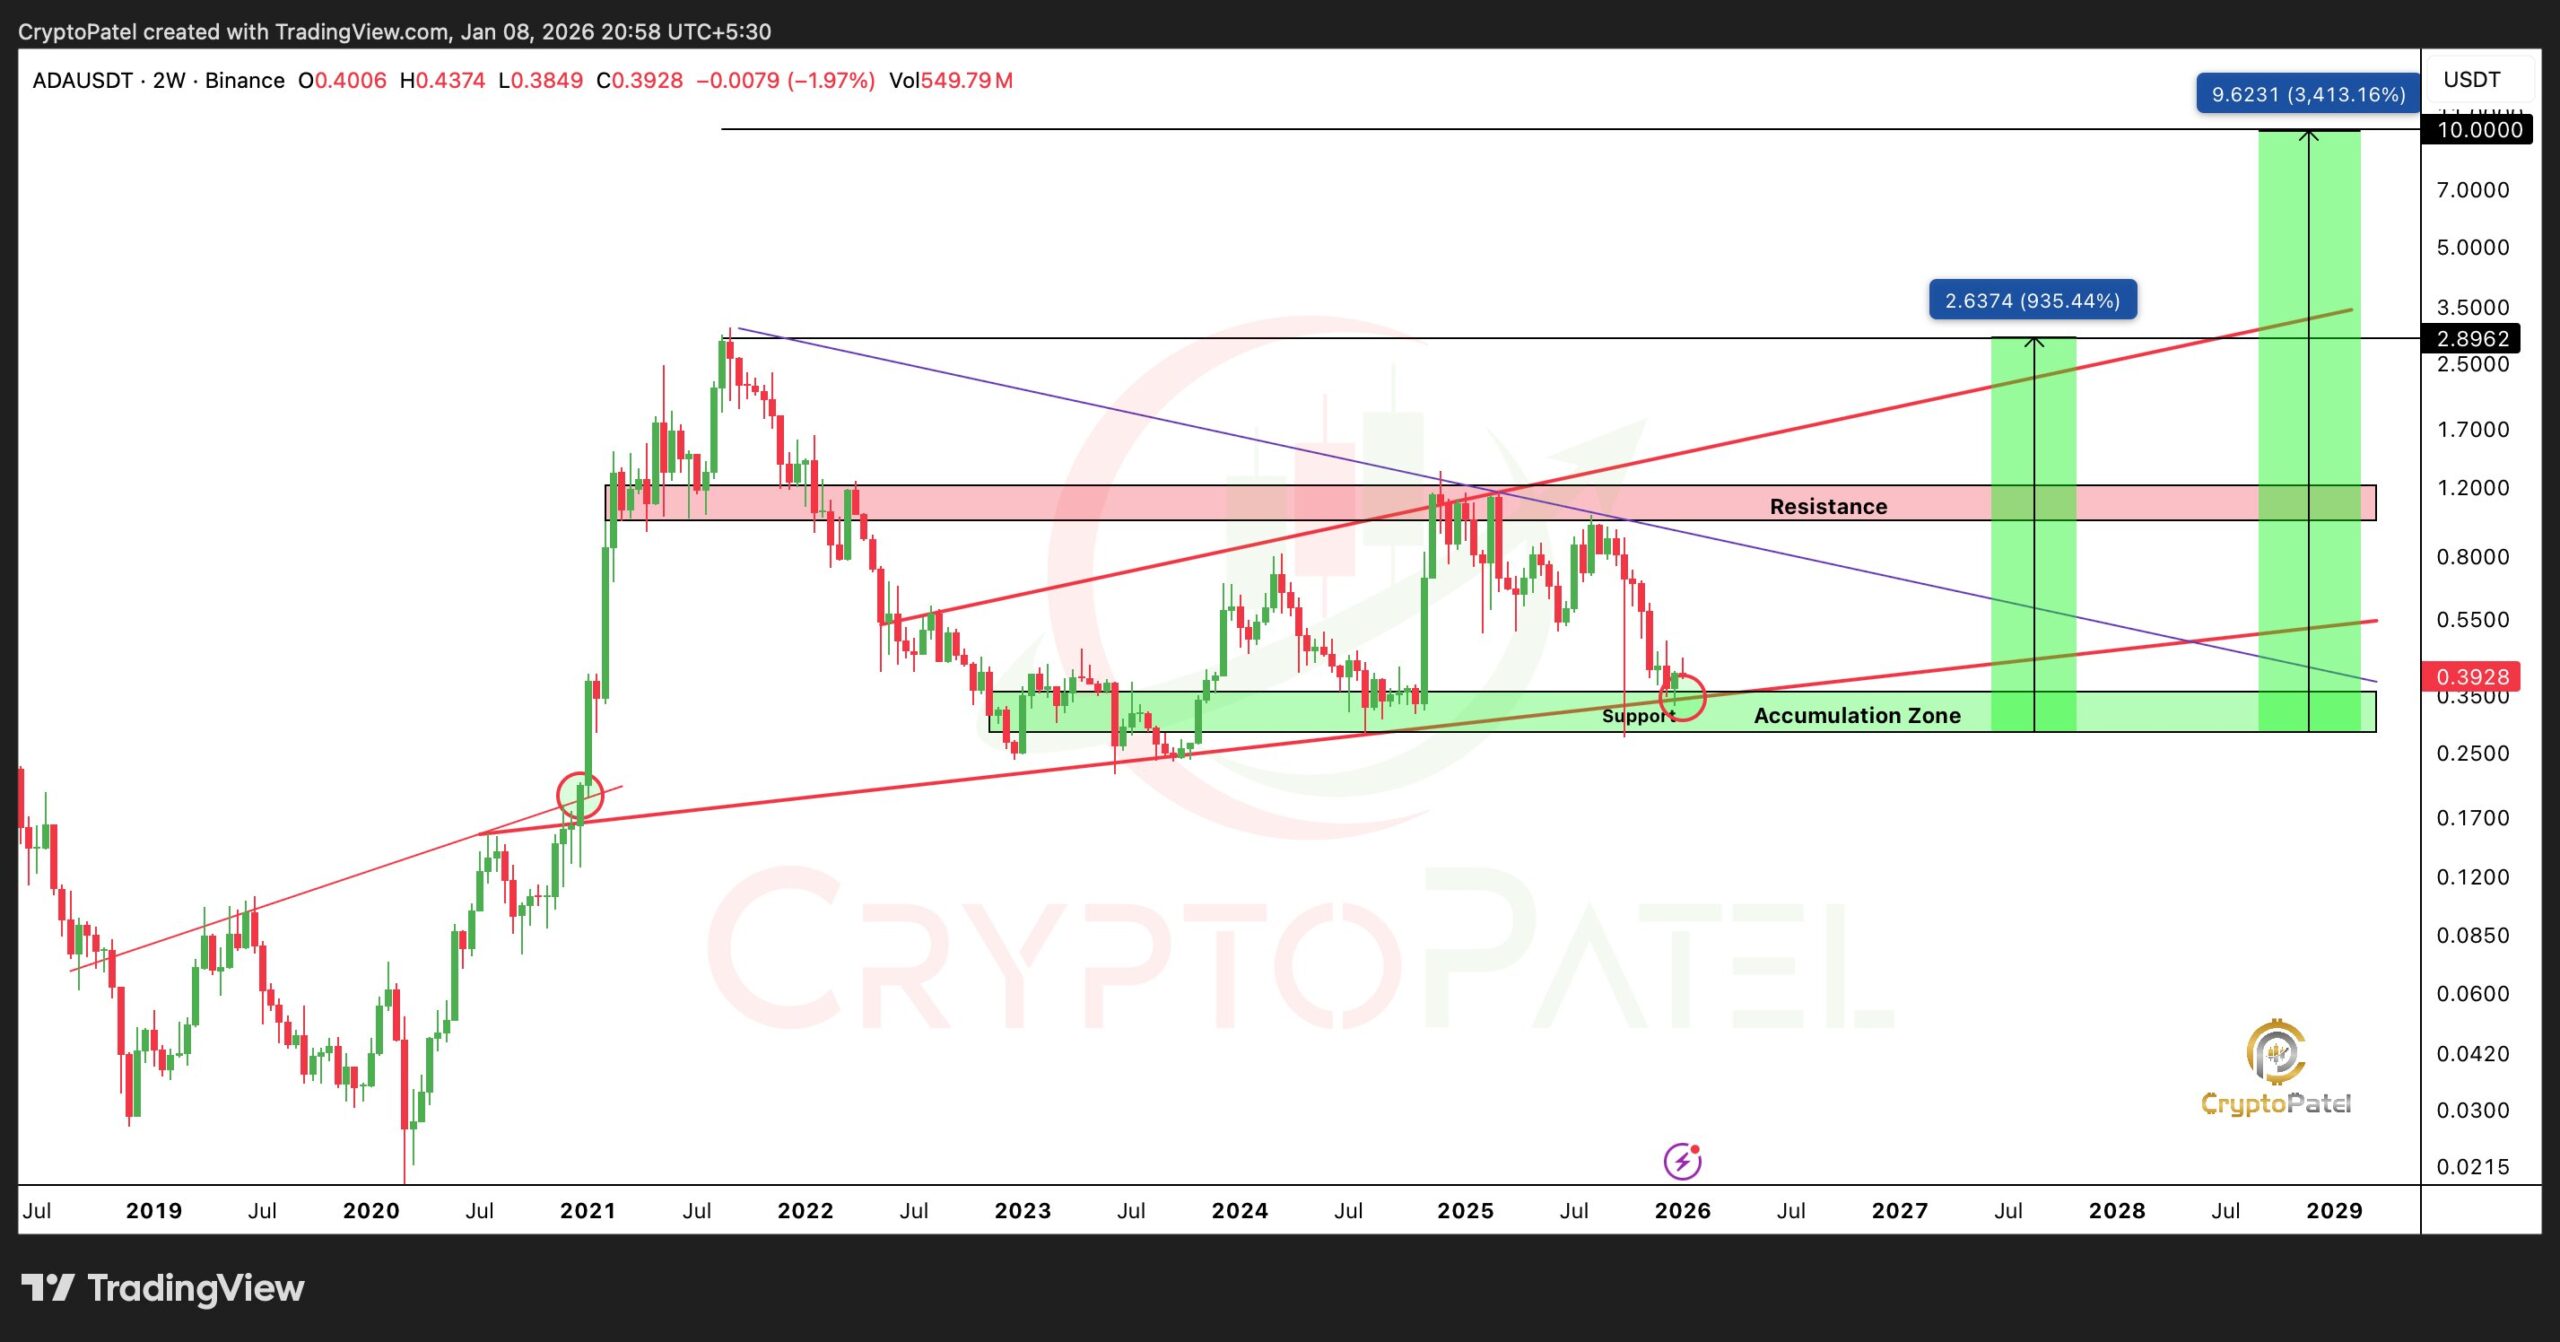
A symmetrical triangle forms when price prints lower highs and higher lows, then compresses into a tightening range as buyers and sellers converge.
Here, that compression sits inside a multi year correction, with the chart framing the current region as an accumulation zone.
As long as ADA holds above roughly $0.30 on a closing basis, the structure stays intact on this view, because the market keeps defending the same high timeframe floor that has repeatedly absorbed sell offs.
The chart also highlights the main breakout band near $1.00 to $1.20, which overlaps prior supply and the broader resistance zone drawn across the $1.00 area.
If ADA reclaims that band and holds above it, the triangle would shift from compression to expansion, because price would clear the ceiling that capped rebounds through 2022 to 2025.
From the current ~$0.39 level, a move to $1.00 equals about 155% upside, while $1.20 implies about 205%.
Beyond that breakout area, the targets shown on the chart sit near $2.60, $5.00, and $10.00, which would equal roughly 562%, 1,173%, and 2,446% upside from ~$0.39, respectively.
However, the invalidation level on this setup remains clear: a weekly close below about $0.28 would break the marked demand zone and weaken the triangle support base, shifting focus toward deeper downside levels rather than a continuation move.
Disclosure:This article does not contain investment advice or recommendations. Every investment and trading move involves risk, and readers should conduct their own research when making a decision.
Kriptoworld.com accepts no liability for any errors in the articles or for any financial loss resulting from incorrect information.

Tatevik Avetisyan is an editor at Kriptoworld who covers emerging crypto trends, blockchain innovation, and altcoin developments. She is passionate about breaking down complex stories for a global audience and making digital finance more accessible.
📅 Published: January 9, 2026 • 🕓 Last updated: January 9, 2026
