


Chainlink trades inside a confirmed daily downtrend on the chart dated Dec. 4, 2025. Price stays below the descending blue trendline that has capped every rally since early September.
The structure shows sellers still control the broader direction even after the latest sharp rebound.
Stay ahead in the crypto world – follow us on X for the latest updates, insights, and trends!🚀
At the same time, LINK pushes back toward the key zone where the next major decision will form.
Price now trades near 14.6 dollars after a strong multi-day recovery. However, the broader trend remains bearish because LINK still moves under the 50-day exponential moving average around 15.31 dollars.
Each time price approached this moving average during the past three months, the bounce faded.
Therefore, the trend stays intact until LINK closes firmly above it. The down-sloping trendline adds a second barrier, reinforcing the need for a break above the same region.
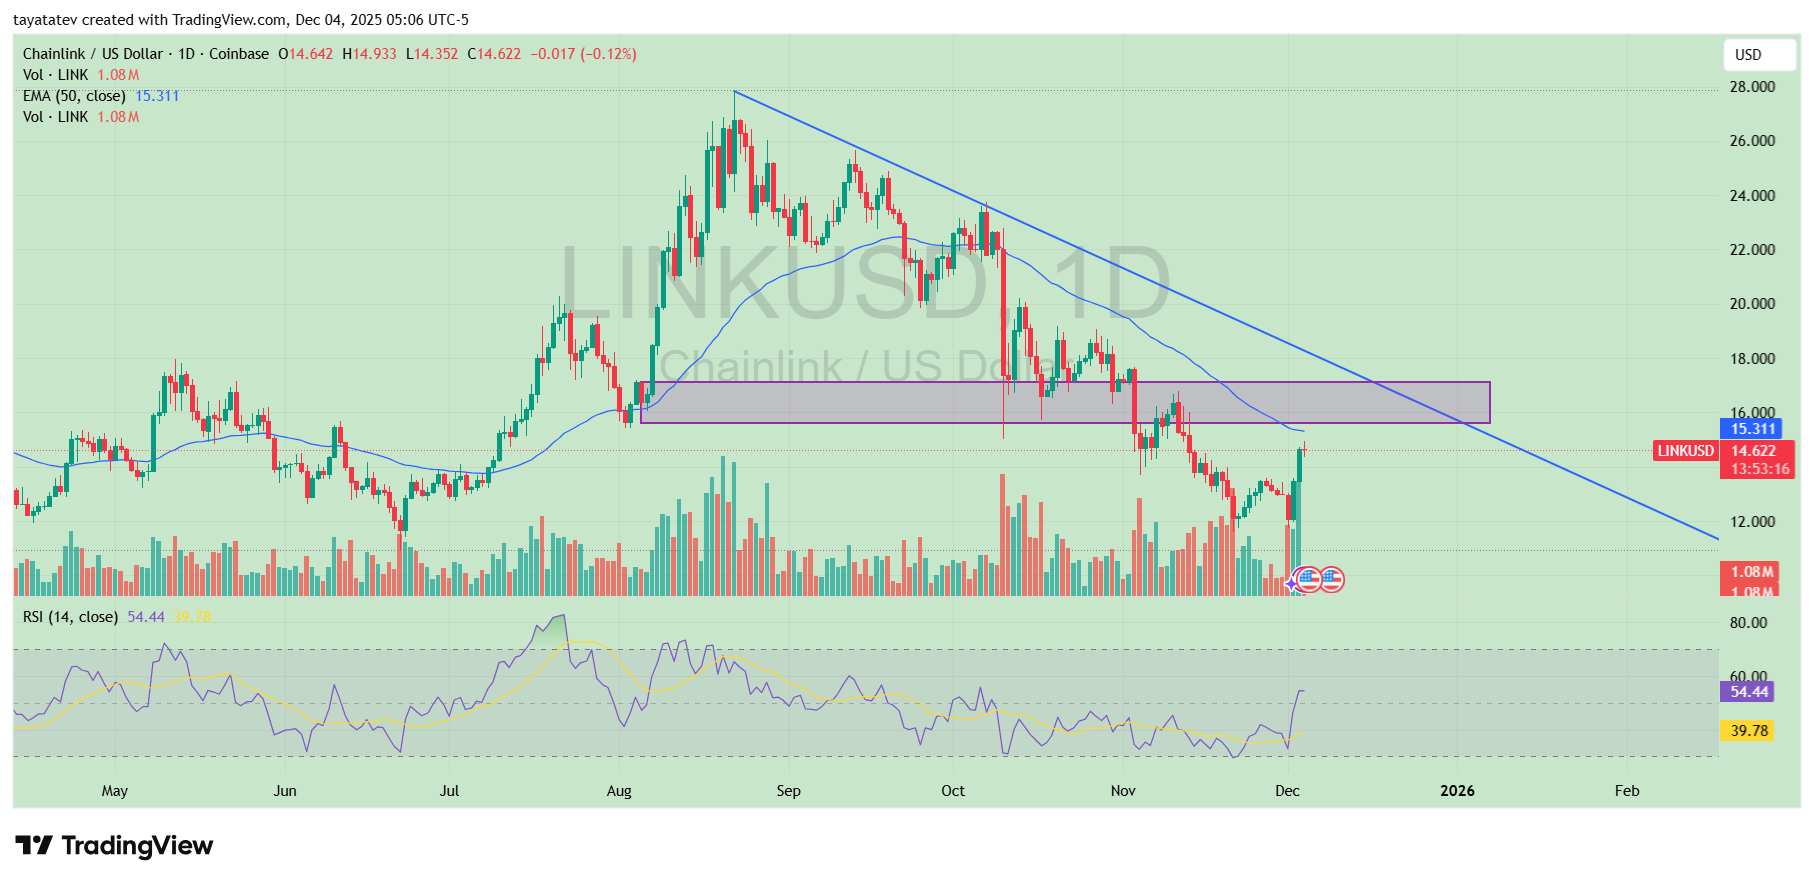
The chart also highlights a wide fair value gap between roughly 15 and 17 dollars. This zone overlaps with previous consolidation from September and October.
It also acted as support before turning into resistance during the breakdown. Because price reenters this zone for the first time since mid-November, LINK must break through it to signal real trend exhaustion.
A daily close above the upper boundary near 17 dollars would confirm the first higher high since August and would shift the structure into an early uptrend.
Volume increased during the rebound, which shows stronger participation compared with the late-November selloff. However, the reaction still needs follow-through above resistance to invalidate the larger downtrend.
At the same time, the RSI rises from oversold levels and now prints above 54. This move signals improving strength, but momentum remains early because LINK has not crossed any major trend markers yet.
Until LINK breaks above the 15 to 17 dollar resistance and clears both the fair value gap and the descending trendline, the market structure continues to favor the downtrend.
The current bounce marks the first strong reversal attempt, yet trend confirmation requires a daily close outside this zone.
Chainlink Breaks 4-Hour Channel as ETF Inflows and Whales Lift Price
On the 4-hour LINK/USD chart dated Dec. 4, 2025, Chainlink has broken out of a descending channel that guided price since early September.
Candles had repeatedly respected the two falling white trendlines, confirming a persistent intraday downtrend.
The latest move pushed price out of the upper boundary for the first time in months, marking a clear shift in short-term structure.
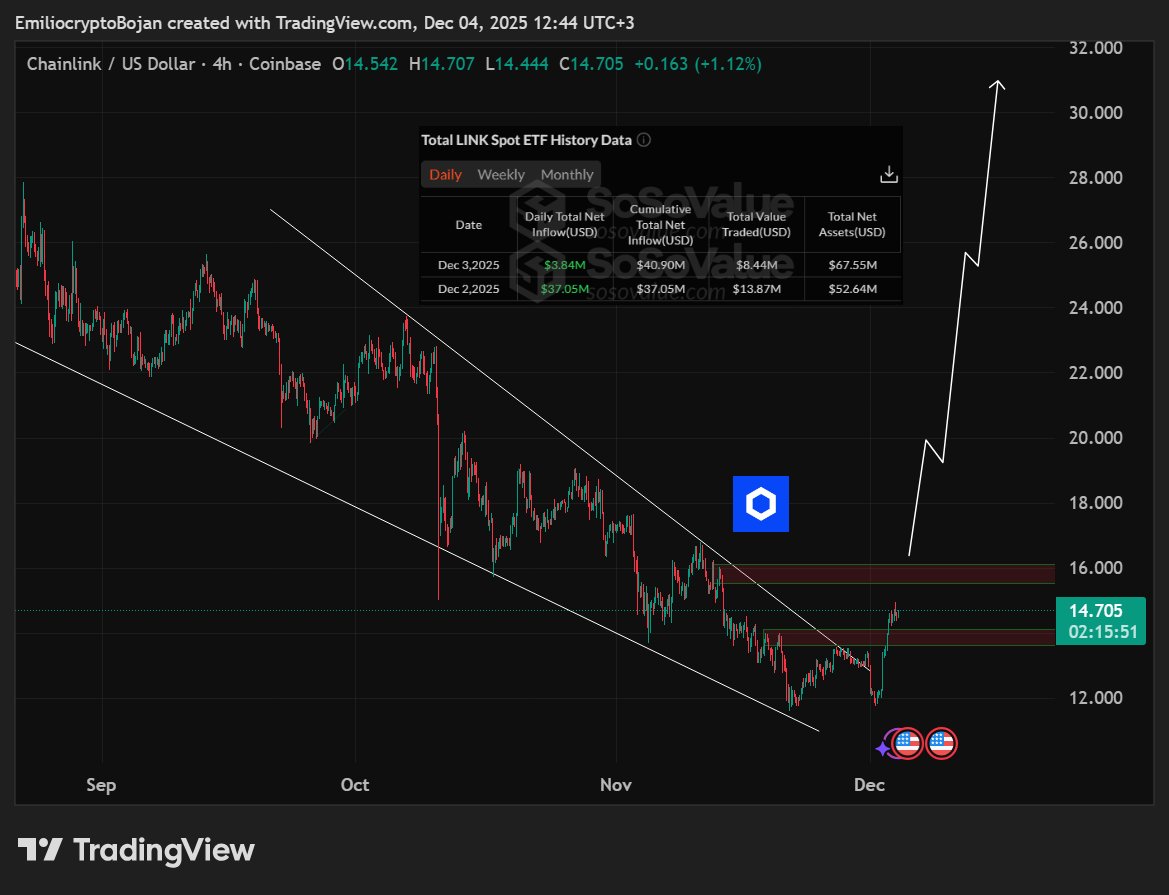
After the breakout, LINK trades near 14.7 dollars and now faces a stacked resistance band between roughly 15 and 16 dollars.
This zone lines up with previous supply from November and late October, when every rebound stalled and reversed. As long as price stays below this band, the move remains an early reversal attempt within a broader corrective phase.
A clean 4-hour close above 16 dollars would confirm that buyers have reclaimed this former ceiling and opened room toward higher levels on the chart.
The image overlay highlights fresh spot ETF flows into Chainlink products. The panel shows net inflows of about 37.05 million dollars on Dec. 2 and 3.84 million dollars on Dec. 3, with cumulative inflows near 40.9 million dollars and total net assets above 67 million dollars.
Rising ETF demand, combined with visible large orders from new whales, supports the breakout narrative by adding on-chain and flow data to the price move.
At the same time, the long white projection arrows on the chart sketch possible upside paths toward the mid-20 and 30-dollar region if resistance breaks and momentum extends.
These lines illustrate potential continuation scenarios rather than confirmed targets.
For now, the key focus stays on how LINK behaves around the 15 to 16 dollar resistance band: holding above the channel breakout while clearing this zone would strengthen the case that the downtrend on the 4-hour timeframe has begun to reverse.
Disclosure:This article does not contain investment advice or recommendations. Every investment and trading move involves risk, and readers should conduct their own research when making a decision.
Kriptoworld.com accepts no liability for any errors in the articles or for any financial loss resulting from incorrect information.

Tatevik Avetisyan is an editor at Kriptoworld who covers emerging crypto trends, blockchain innovation, and altcoin developments. She is passionate about breaking down complex stories for a global audience and making digital finance more accessible.
📅 Published: December 4, 2025 • 🕓 Last updated: December 4, 2025
