


Chainlink continues to trade within a broader downtrend, and current price action does not yet confirm a trend reversal.
As of the latest daily close, LINK trades near $12.7, holding well below both the descending trendline and the 50 day exponential moving average.
Stay ahead in the crypto world – follow us on X for the latest updates, insights, and trends!🚀
This structure keeps downside pressure intact despite short term stabilization.
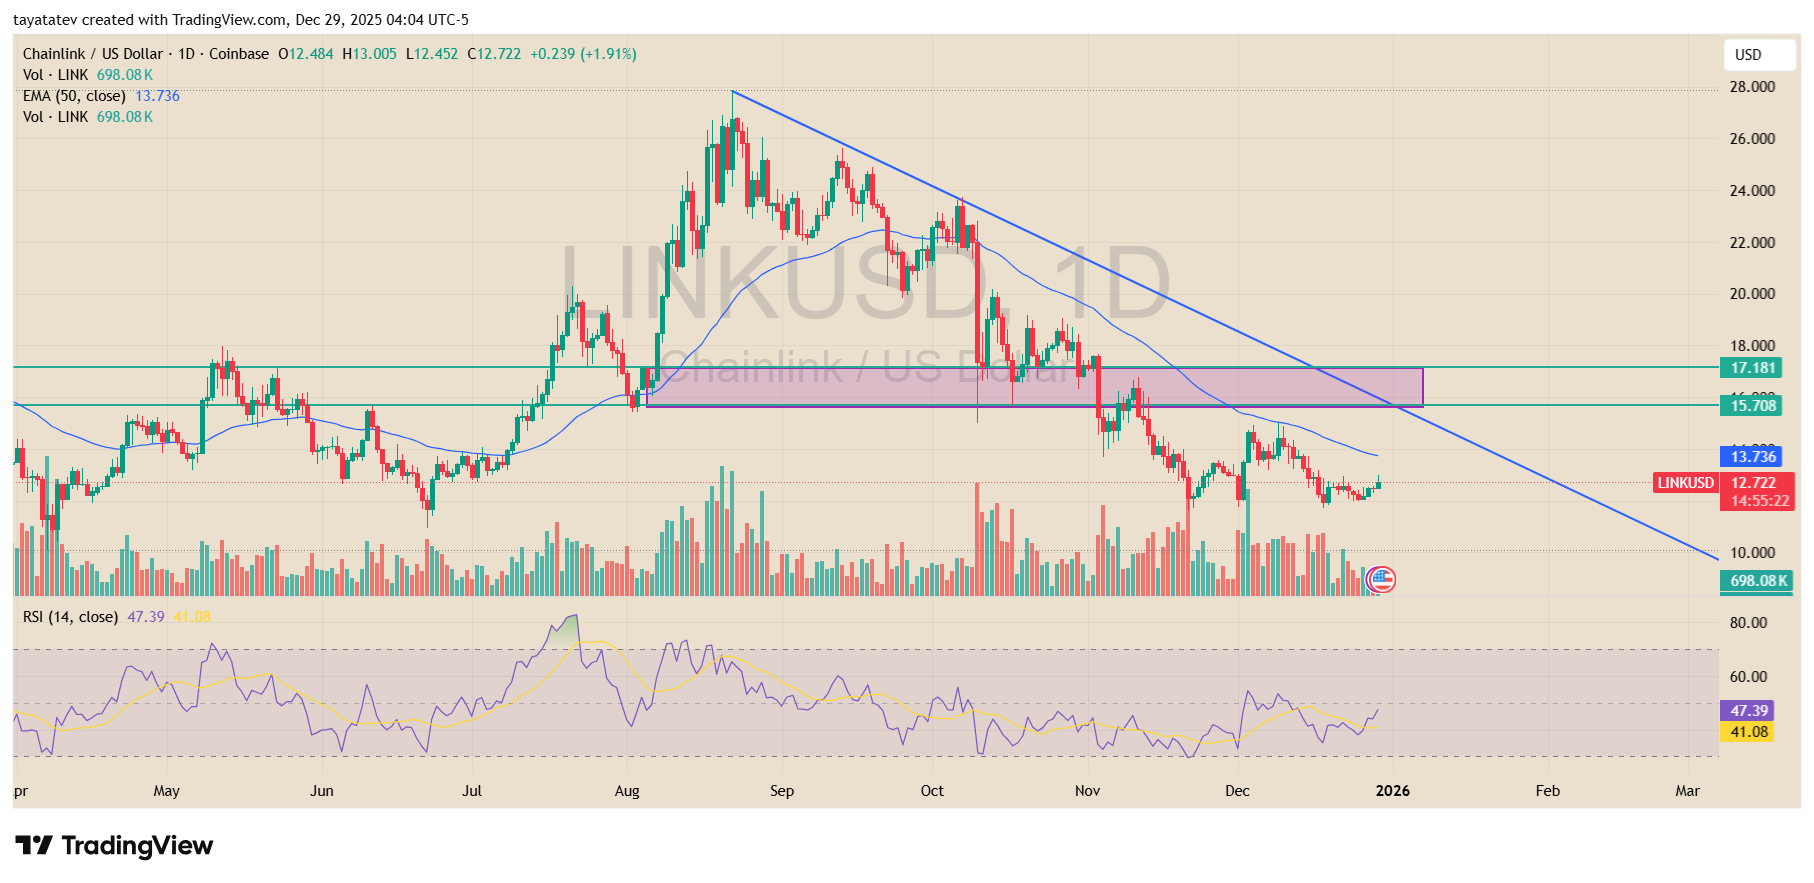
The chart shows a clear sequence of lower highs since the September peak near the mid $20s. Each rebound has failed below prior resistance, while the descending trendline continues to cap upside attempts.
As a result, the dominant structure remains bearish. Price also trades below the former demand zone marked between roughly $15.7 and $17.2, which now acts as overhead resistance rather than support.
Meanwhile, the 50 day EMA sits near $13.7 and slopes downward, reinforcing the prevailing downtrend.
LINK has struggled to reclaim this moving average since October. Until price closes decisively above the EMA and holds, momentum remains aligned with sellers rather than buyers.
Volume data also shows no sustained expansion on recent upticks, which limits the strength of the current bounce.
At the same time, the RSI offers early stabilization signals but not confirmation.
The indicator trades near the mid 40s, reflecting neutral momentum rather than bullish strength.
While RSI has lifted from oversold conditions seen in November, it remains below the 50 level. This suggests consolidation within a downtrend rather than a confirmed reversal.
Structurally, the $15.7 level remains the key threshold. A daily close above $15.7, followed by acceptance above the former range, would mark a shift in market structure.
Such a move would also place price back above the previous support zone and closer to the descending trendline, opening room for a broader trend reassessment.
Until that level breaks, LINK remains in a downtrend by definition. Price continues to form lower highs, trade below key moving averages, and respect descending resistance.
Short term rebounds may occur, but the broader structure does not support an uptrend classification at current levels.
LINK Weekly Chart Shows Long Squeeze Zone as Price Tests Rising Support
Chainlink price sits inside a compression zone where a long descending trendline meets a rising support line.
This structure keeps LINK in a broad downtrend from the 2021 peak, while the market also presses into a level that has repeatedly triggered bounces and breakdowns.
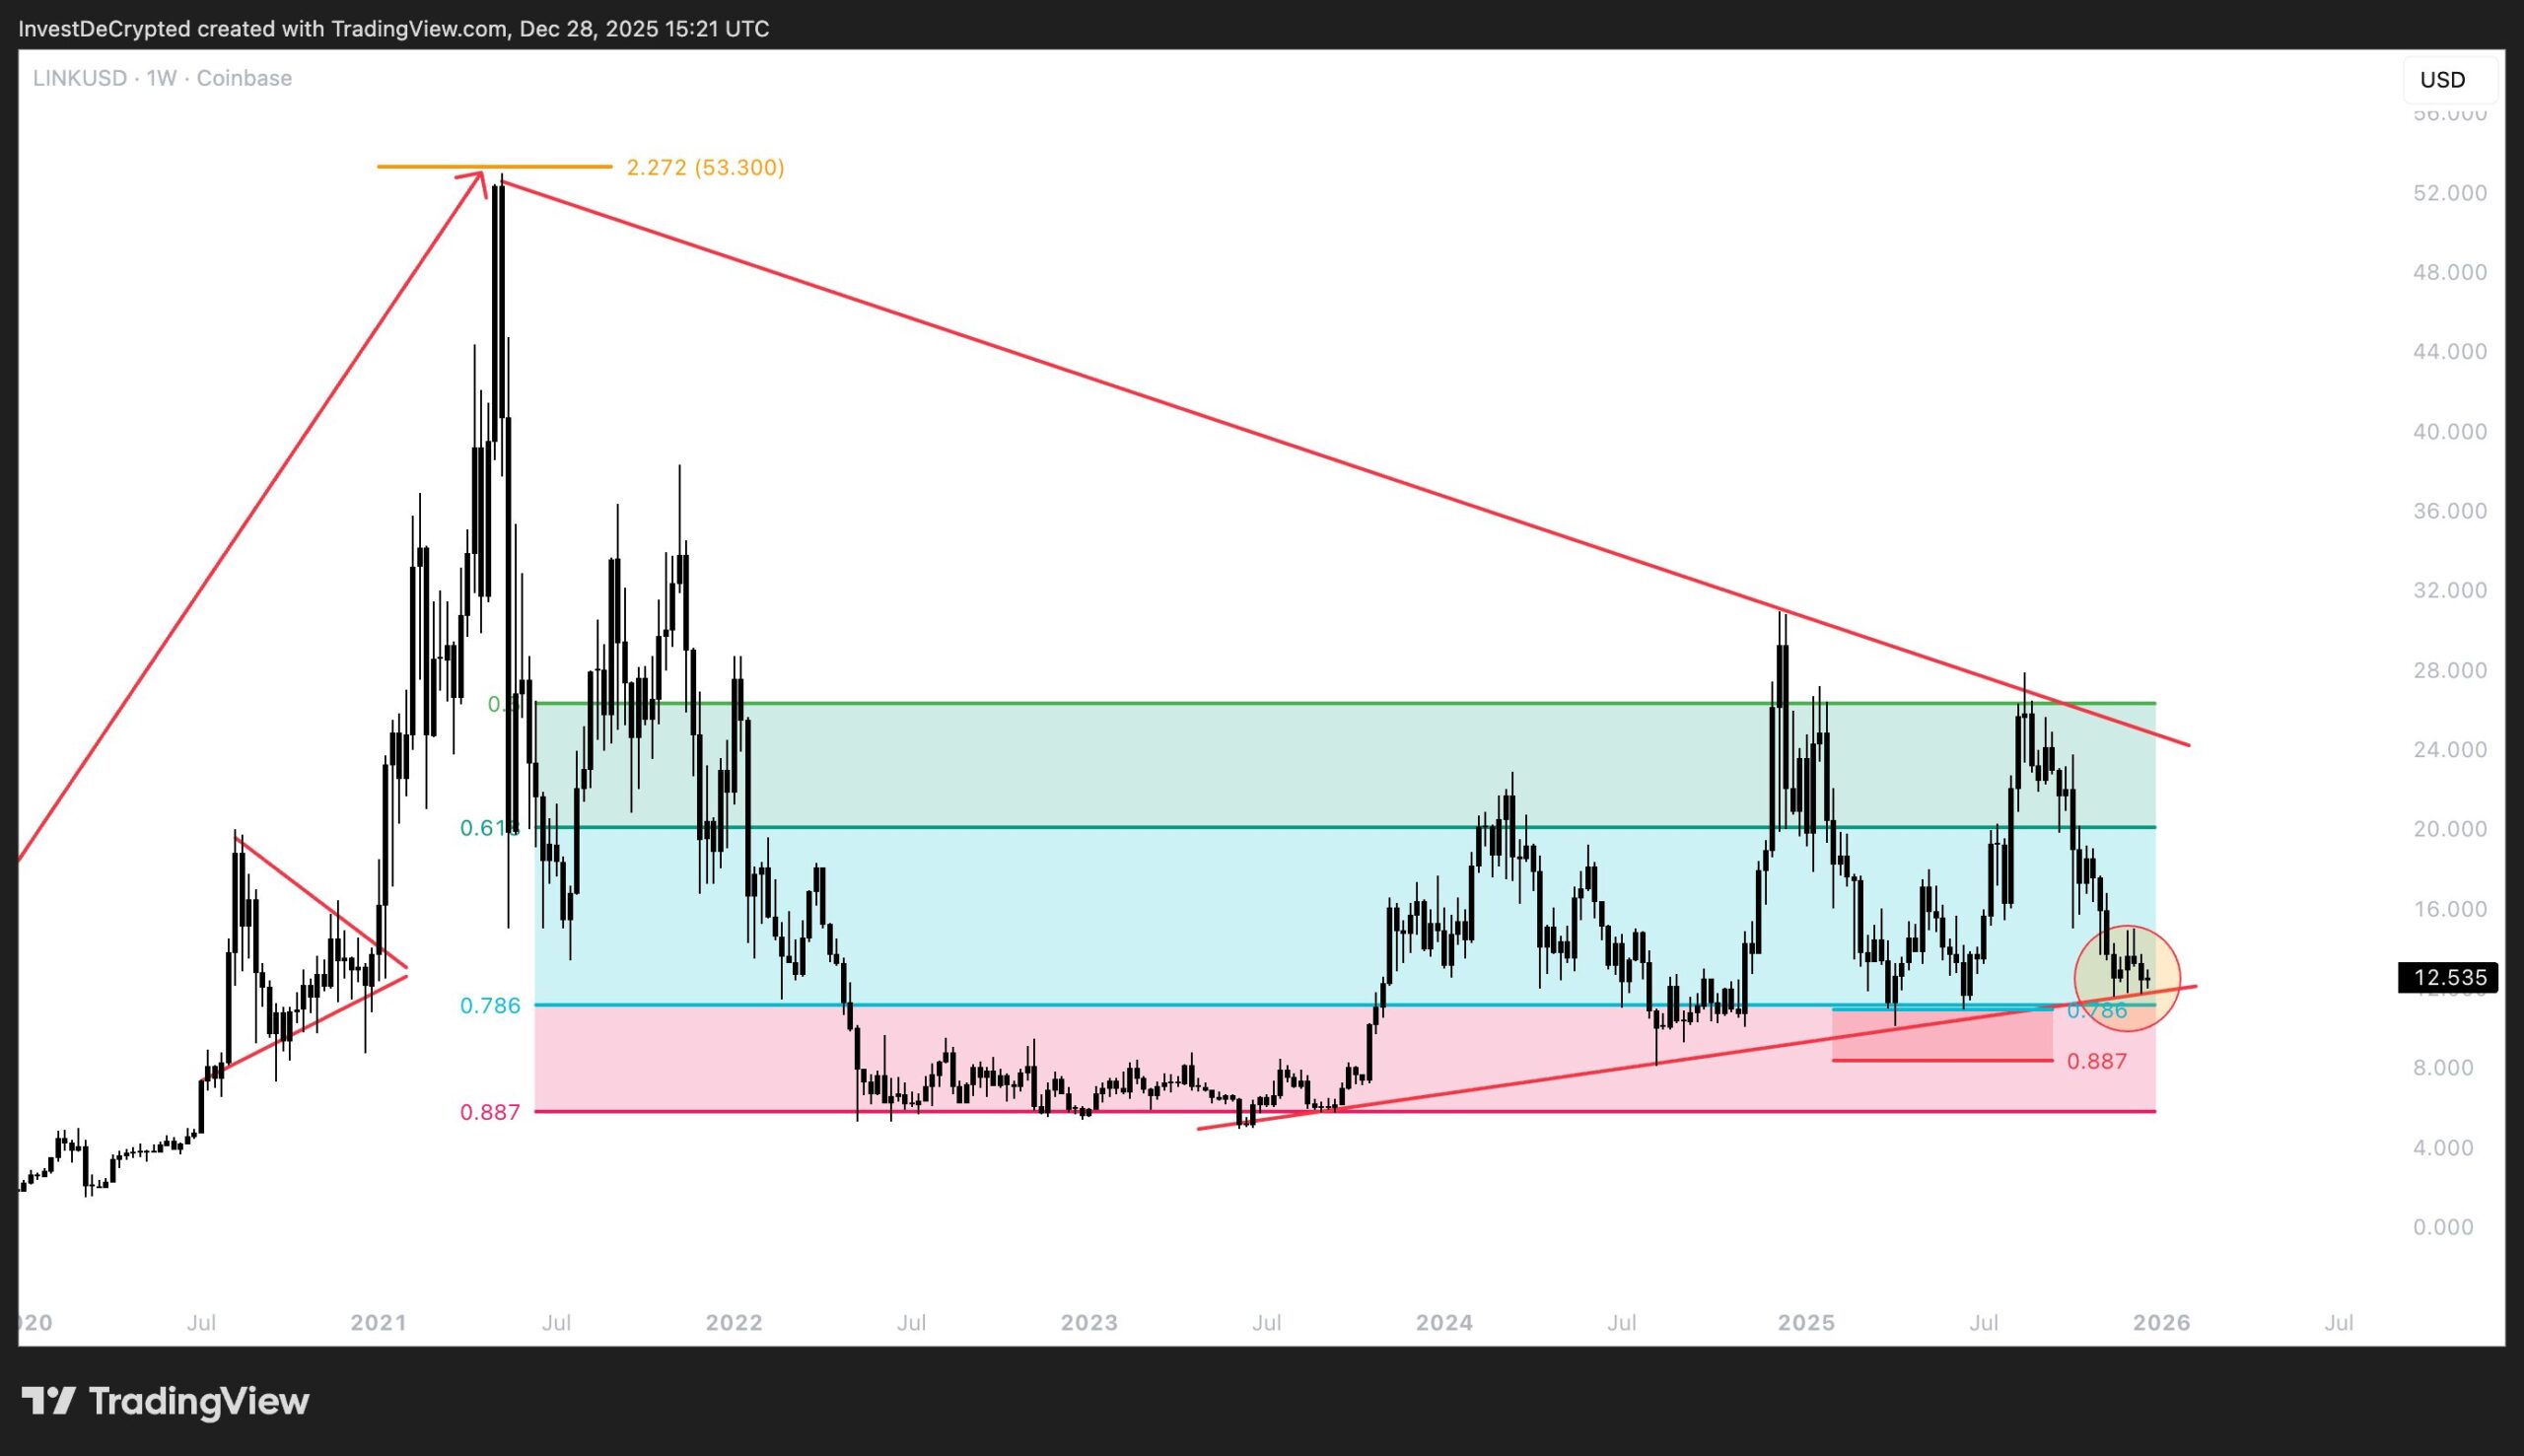
The chart maps a large Fibonacci retracement range across the multi year move. LINK now trades around the 0.786 area, with the lower band near the 0.887 level acting as the next downside reference.
The circled region highlights this 0.786 zone as the current decision point, since candles keep closing near the same support area rather than rebounding sharply.
At the same time, the descending red trendline from the 2021 top continues to cap upside attempts.
Price failed multiple times below the broad resistance zone shown between roughly the low $20s and the mid $20s, which matches the shaded range on the chart.
Until LINK reclaims that region and holds above it on weekly closes, the higher time frame trend remains constrained by lower highs.
Meanwhile, the rising support line from the 2022–2023 base still holds, and it forces price into a tighter range as the chart approaches 2026.
This squeeze often produces expansion, because the market cannot stay compressed forever.
However, the direction still depends on which side breaks first, since the structure allows for either a continuation lower through support or a rebound that challenges the overhead resistance band.
Chart context also supports the “frustration” framing without turning it into a call to action. Price has spent long periods moving sideways after sharp swings, and that type of action usually reduces visible retail participation.
In this setup, the chart mainly shows positioning pressure building near support, while the long term downtrend line still controls the upside.
Disclosure:This article does not contain investment advice or recommendations. Every investment and trading move involves risk, and readers should conduct their own research when making a decision.
Kriptoworld.com accepts no liability for any errors in the articles or for any financial loss resulting from incorrect information.

Tatevik Avetisyan is an editor at Kriptoworld who covers emerging crypto trends, blockchain innovation, and altcoin developments. She is passionate about breaking down complex stories for a global audience and making digital finance more accessible.
📅 Published: December 29, 2025 • 🕓 Last updated: December 29, 2025
