


Dash has risen over the past three sessions, extending a short-term rebound after stabilizing near early January lows.
On the latest daily close, Dash ended near $59.76 on Coinbase, up from the low-$50 area three days earlier, based on the TradingView daily chart dated Jan. 14, 2026.
Stay ahead in the crypto world – follow us on X for the latest updates, insights, and trends!🚀
The advance followed a push toward an intraday high near $61.23 and came with higher activity, as daily volume reached about 96,980 DASH.
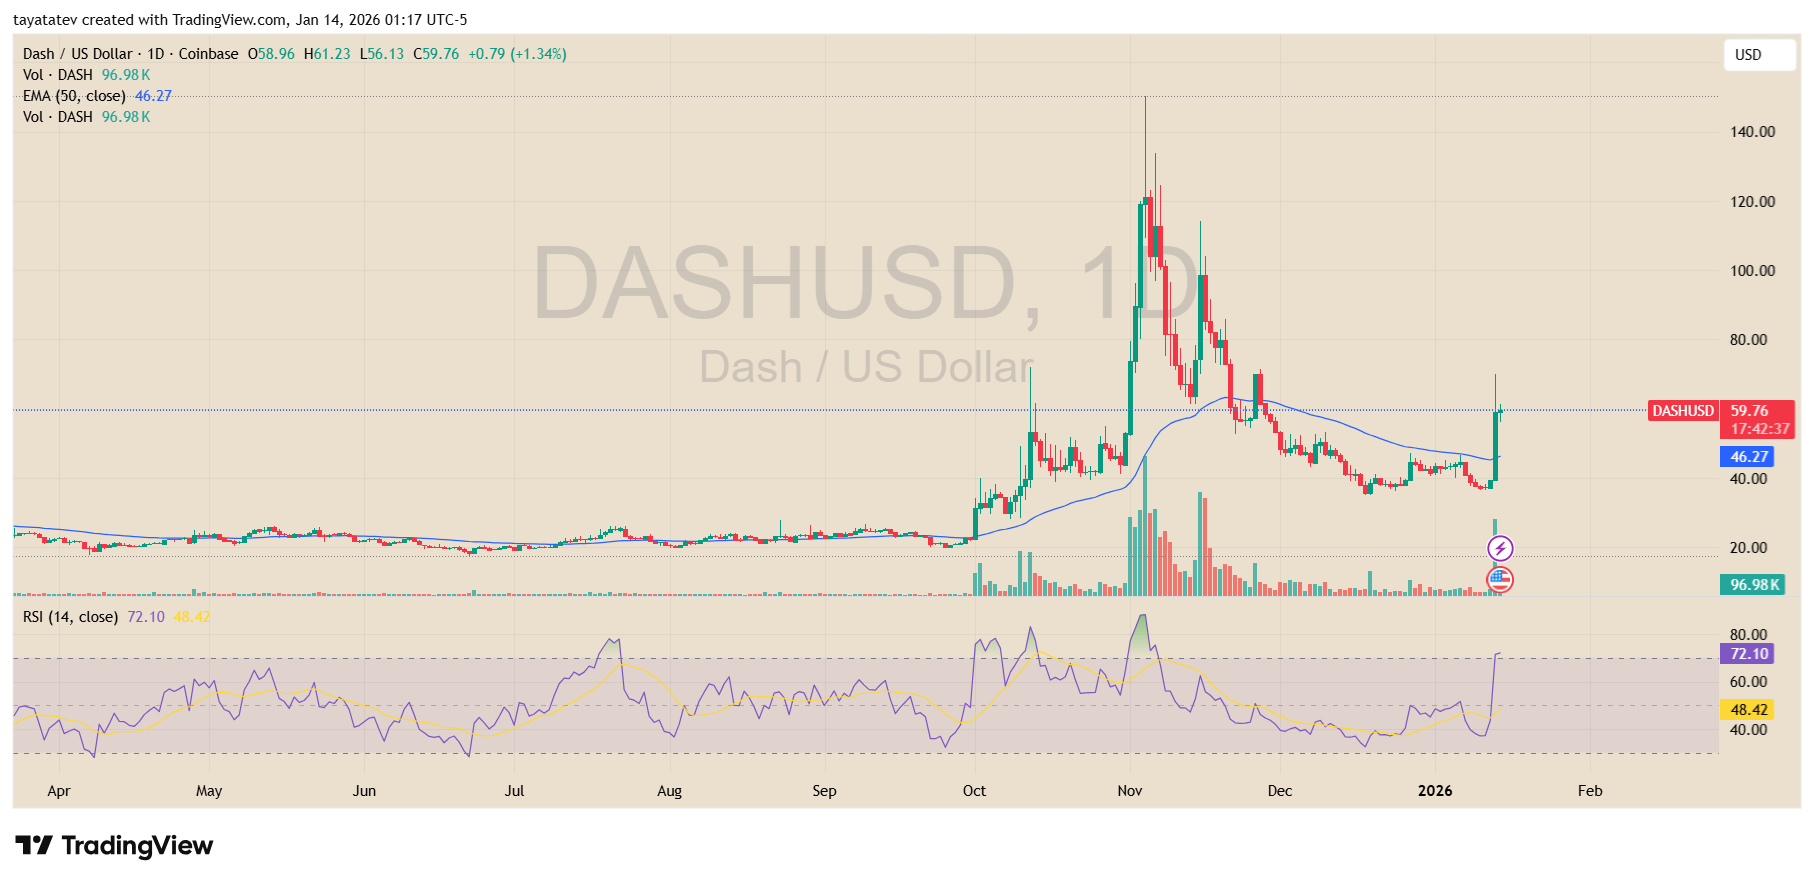
During the three-day move, Dash climbed back above its 50-day exponential moving average, currently near $46.27.
This level had acted as a ceiling through December and early January. By reclaiming it, price shifted from a flat consolidation into a recovery phase.
At the same time, candles expanded in range, showing stronger participation than in prior sessions when Dash traded sideways.
Momentum indicators reflected the pickup. The 14-day relative strength index rose to about 72, moving into overbought territory.
This reading signals strong short-term demand but also suggests that upside may slow if buyers fail to extend the move.
In previous periods on the same chart, similar RSI levels often coincided with brief pauses or pullbacks rather than immediate trend reversals.
From a wider view, Dash remains well below its November spike above $120, which was followed by a sharp decline and months of lower highs. Since then, price has spent several weeks forming a base between roughly $40 and $45 before turning higher.
The current three-day rebound indicates an attempt to build a higher low, although the broader structure still depends on follow-through above reclaimed levels.
Next, the $60 to $65 zone stands out as nearby resistance, where selling pressure emerged during the late-2025 downtrend.
Holding above the 50-day EMA would keep short-term conditions constructive, while a drop back below it would likely return Dash to its prior range.
For now, the chart shows a three-day recovery supported by higher volume and improving momentum, defining the near-term setup.
Dash pushes higher after breakout as chart points to higher price zone
Dash extended its rebound after breaking out of a multi-week consolidation range, according to the TradingView weekly chart shared on Jan. 14, 2026.
Price traded near $60.90 at the time of the chart, up sharply from the late-December base around the mid-$30 area.
The move followed a clear expansion in range after Dash held above prior support and invalidated the recent downward structure.
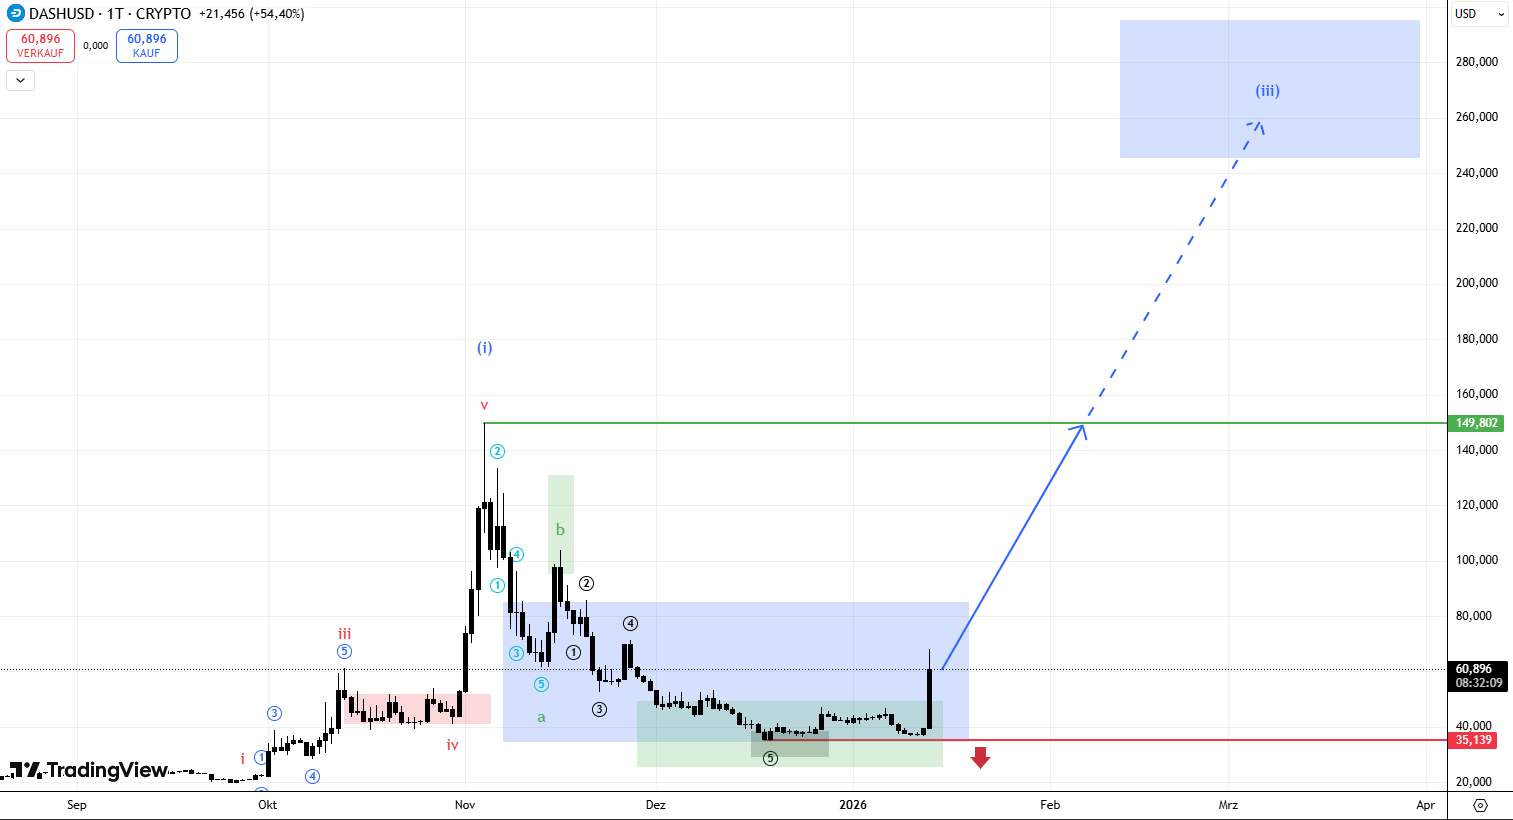
The chart shows Dash completing a corrective phase and moving out of a broad accumulation zone that developed through December and early January.
Price reclaimed the upper boundary of that range near $55 to $60, which had previously capped upside attempts. This breakout marked a shift in structure, as Dash moved from compression into directional expansion.
From a longer-term view, the chart highlights a prior resistance area near $150, which aligns with the upper boundary of a former distribution zone. That level now stands as the next major reference point if momentum continues.
Beyond that, the projection on the chart points toward a higher price zone near $245, which corresponds to a previous high-volume area from earlier cycles. These zones reflect historical reactions rather than short-term targets.
Momentum indicators on the weekly timeframe continue to improve. The setup shows conditions aligning for a bullish crossover on the weekly MACD, which historically signals trend continuation when paired with rising volume.
While volume has increased during the breakout, the chart suggests stronger follow-through would confirm broader participation and reduce the risk of a failed move.
On the downside, the chart marks invalidation below roughly $35.14. A return below that level would place price back inside the prior base and weaken the breakout structure.
For now, Dash holds above former resistance and trades within a developing expansion phase, with price behavior and volume over coming weeks likely to define whether the move extends toward higher historical zones or consolidates again.
Disclosure:This article does not contain investment advice or recommendations. Every investment and trading move involves risk, and readers should conduct their own research when making a decision.
Kriptoworld.com accepts no liability for any errors in the articles or for any financial loss resulting from incorrect information.

Tatevik Avetisyan is an editor at Kriptoworld who covers emerging crypto trends, blockchain innovation, and altcoin developments. She is passionate about breaking down complex stories for a global audience and making digital finance more accessible.
📅 Published: January 14, 2026 • 🕓 Last updated: January 14, 2026
