


Dogecoin shifted into an early uptrend attempt on Jan. 5 after breaking its short-term bearish structure and reclaiming the 50-day exponential moving average on the daily Coinbase chart.
DOGE closed near $0.15036, rising about 0.60% on the day after moving between roughly $0.14870 and $0.15246.
Stay ahead in the crypto world – follow us on X for the latest updates, insights, and trends!🚀
The session marked a clear change from the steady declines seen through November and December.
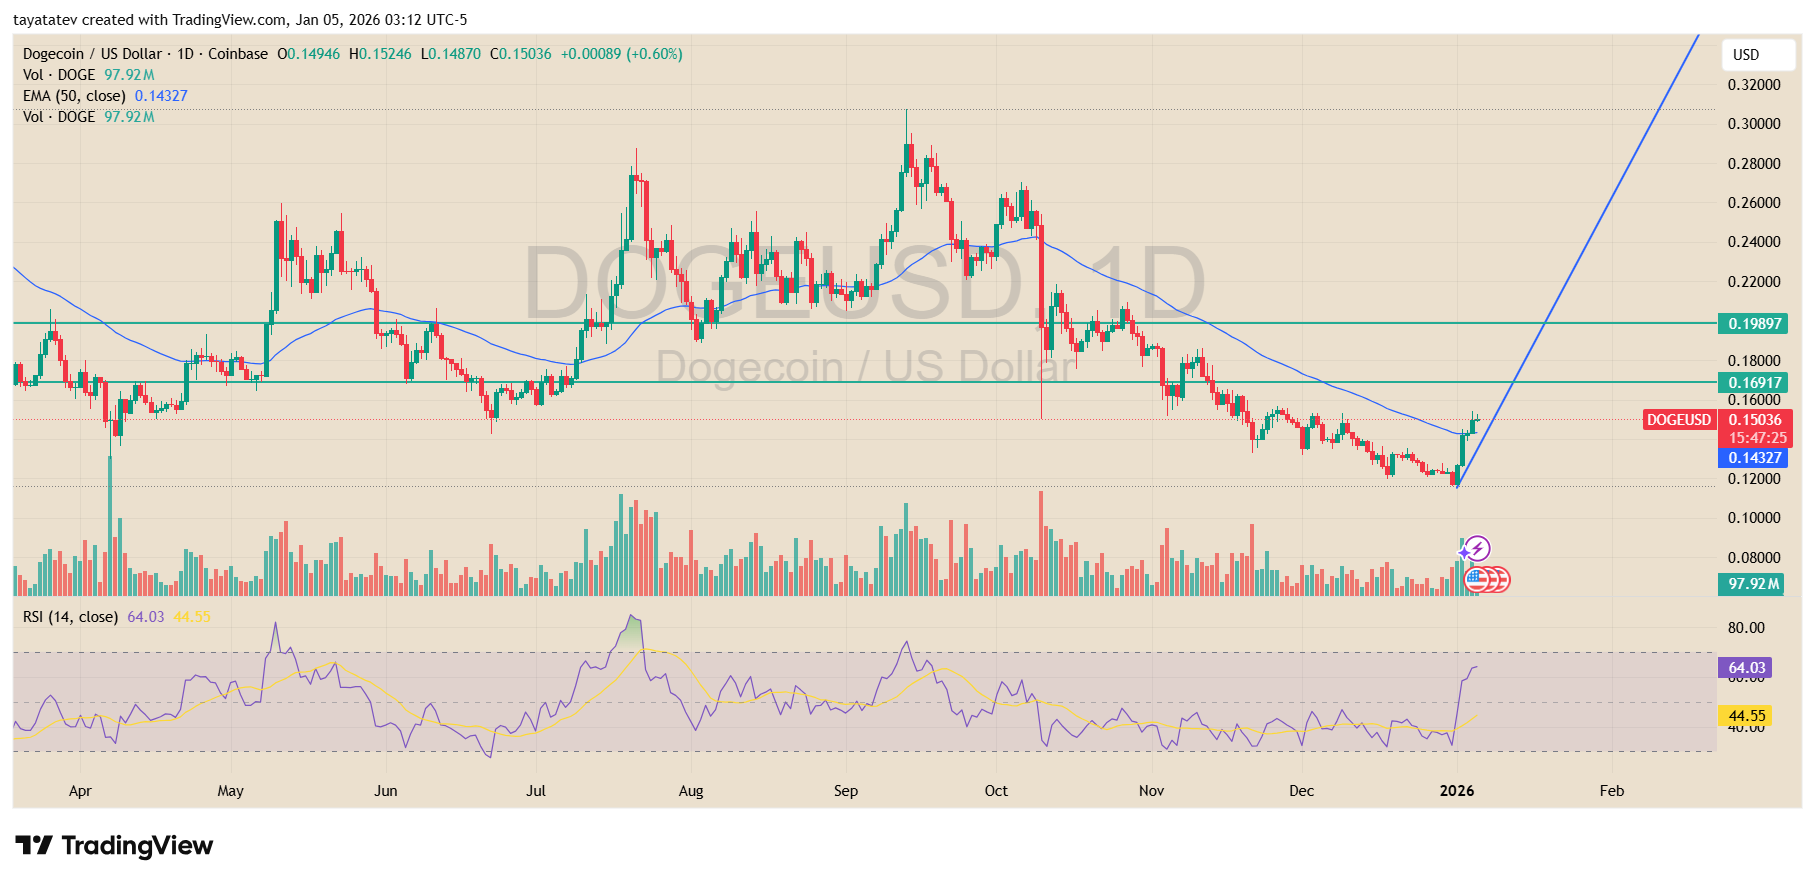
The move followed a sharp rebound from the low $0.12 area at the start of January. That bounce ended the sequence of lower highs and pushed price back above the 50-day EMA, which sits near $0.14327.
When DOGE regains this average after a multi-week slide, it often signals that sellers are losing control and that momentum is shifting toward buyers, provided price continues to hold above it.
Momentum indicators support that shift. The daily RSI (14) climbed to about 64, breaking out of the muted range that defined late December.
At the same time, volume rose to around 97.9 million DOGE, suggesting the rebound came with real participation rather than a thin bounce.
From a structure perspective, the $0.16 area now stands out as the first level that matters.
It lines up with prior consolidation and acts as a nearby test of whether the rebound can extend.
If DOGE clears $0.16 and then holds it on daily closes, the chart opens toward the next resistance band near $0.19, which aligns with a former supply zone marked around $0.198. That zone represents the next logical upside reference if the uptrend continues to build.
On the downside, the 50-day EMA near $0.143 remains the key level to defend.
A sustained move back below it would weaken the uptrend signal and shift focus back toward the early January base near the low $0.12s.
For now, DOGE trades above trend support, and price action shows the first confirmed attempt to turn higher in weeks.
Dogecoin weakens against Bitcoin as long-term downtrend stays intact
Dogecoin continues to lose ground against Bitcoin on the monthly DOGE/BTC chart from Binance, with price still trading inside a broad, multi-year downtrend that has remained in place since the 2021 peak.
At the latest reading, DOGE trades near 0.00000166 BTC, after failing to hold recent bounce attempts.
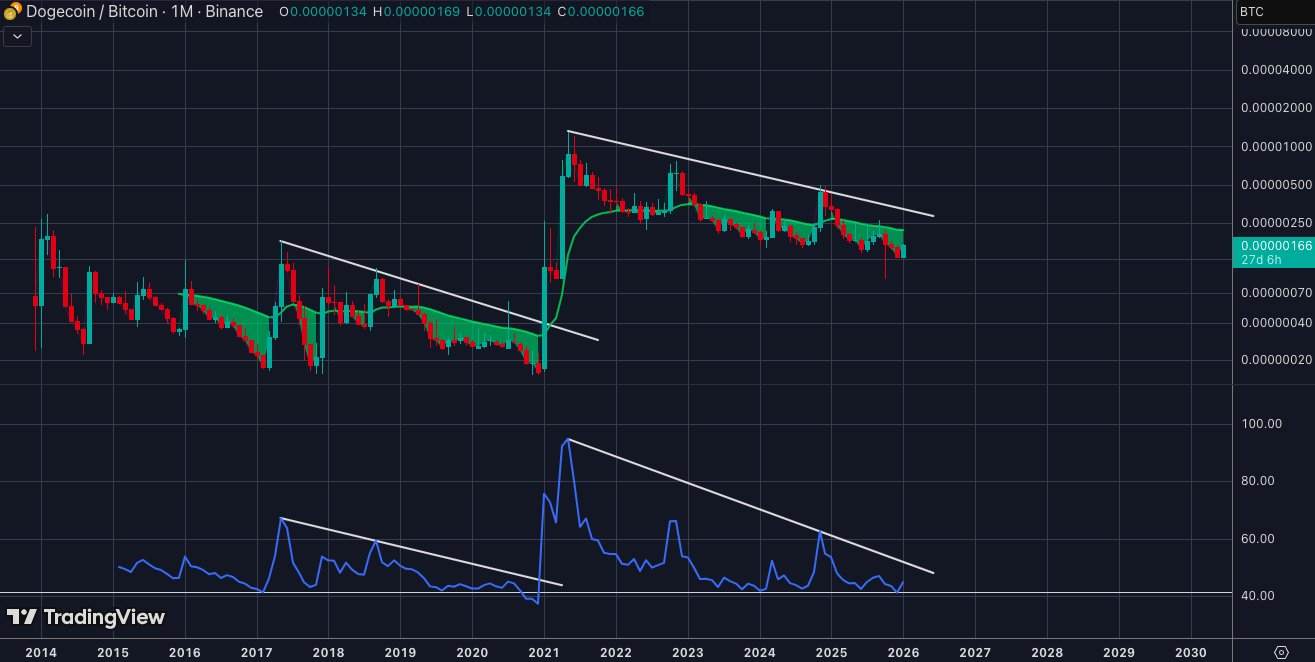
The chart shows a clear pattern of lower highs stretching back several years. Each major rebound against Bitcoin has met descending resistance, marked by the white trendlines.
That structure signals persistent underperformance versus BTC rather than a short-term correction.
Even the sharp 2021 spike, which briefly broke the pattern, quickly reversed and fed back into the same declining structure.
Momentum confirms that picture. The RSI on the monthly timeframe continues to trend lower and remains capped by its own descending resistance line.
Although RSI has bounced from deeply oversold levels in the past, those recoveries have faded without producing sustained upside follow-through. As long as RSI stays suppressed, relative strength against Bitcoin remains limited.
Price action also shows that DOGE struggles to hold reclaimed levels. The green moving average band highlights temporary support during rebounds, but each attempt to build a base has rolled over before breaking the broader trend.
This behavior suggests distribution rather than accumulation when viewed against Bitcoin.
Overall, the DOGE/BTC chart shows no confirmed trend reversal yet. For structure to shift, Dogecoin would need to break above long-term descending resistance and then hold higher monthly closes.
Until that happens, the dominant signal remains relative weakness versus Bitcoin, even if DOGE shows short-term strength on its USD pair.
Disclosure:This article does not contain investment advice or recommendations. Every investment and trading move involves risk, and readers should conduct their own research when making a decision.
Kriptoworld.com accepts no liability for any errors in the articles or for any financial loss resulting from incorrect information.

Tatevik Avetisyan is an editor at Kriptoworld who covers emerging crypto trends, blockchain innovation, and altcoin developments. She is passionate about breaking down complex stories for a global audience and making digital finance more accessible.
📅 Published: January 5, 2026 • 🕓 Last updated: January 5, 2026
