


PEPE saw a sharp shift in structure over the past several sessions, moving from distribution into accelerated downside.
After failing to hold above the 50 period EMA near 0.00000455, price stayed capped under that moving average and printed a series of lower highs.
Stay ahead in the crypto world – follow us on X for the latest updates, insights, and trends!🚀
That behavior confirmed bearish control, as each rebound stalled faster than the previous one. As a result, upside momentum faded steadily instead of producing a clean recovery.
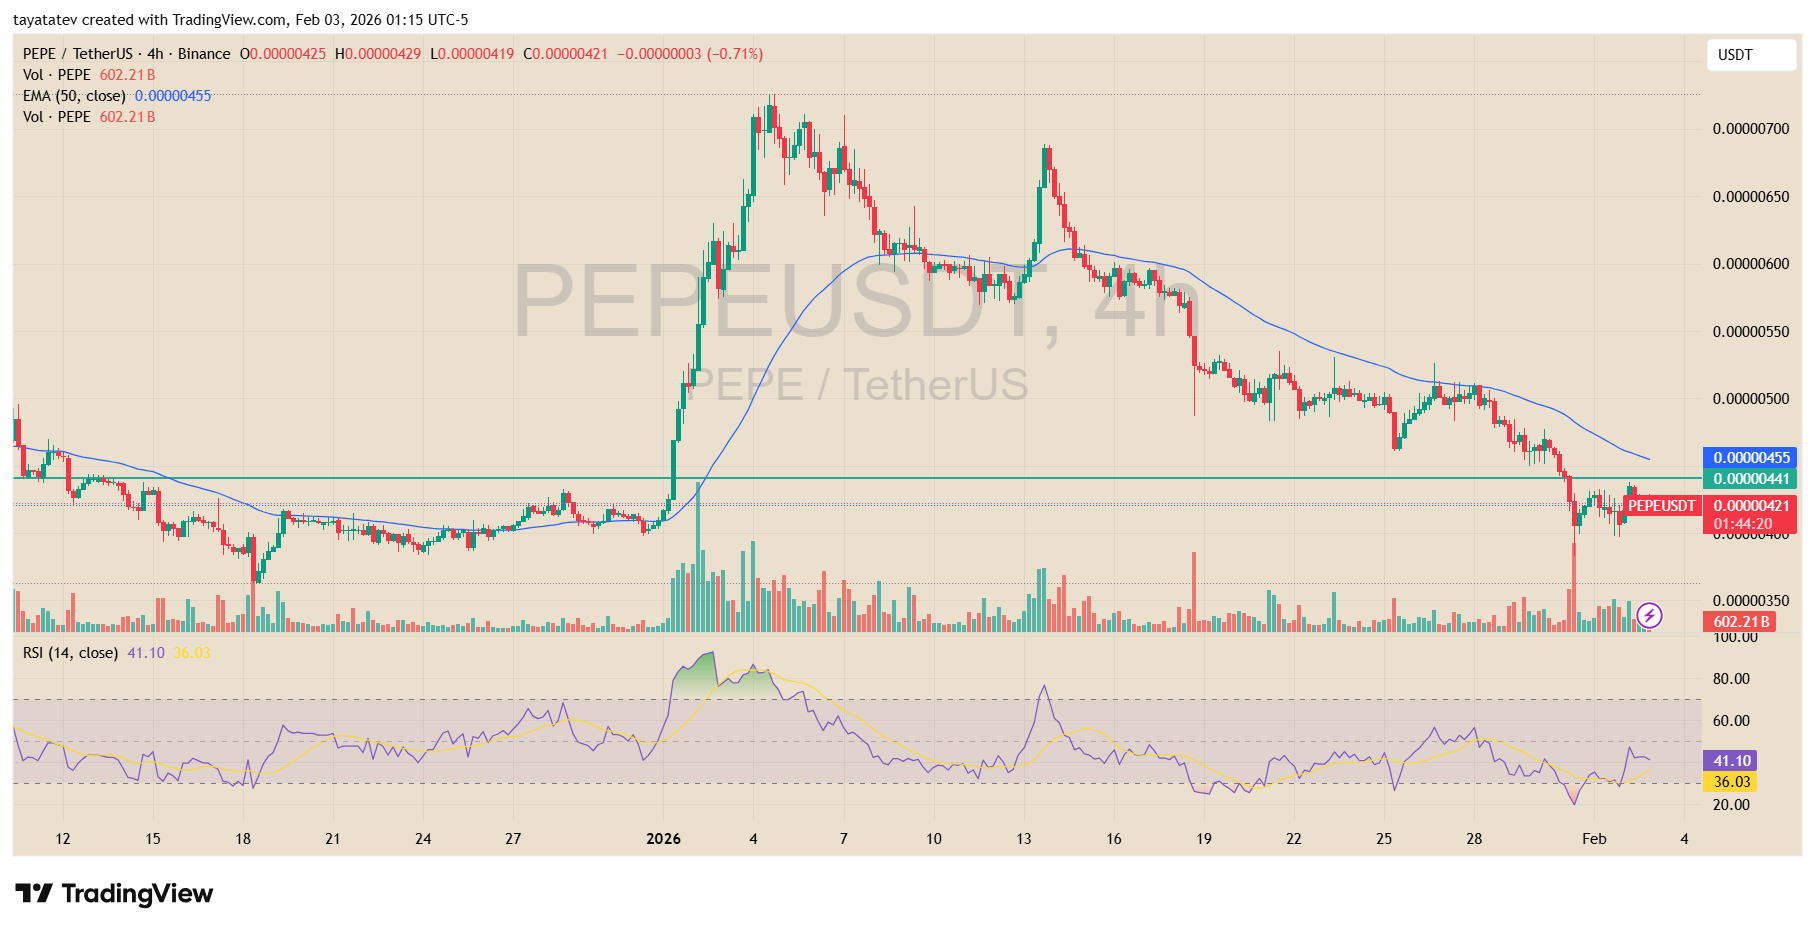
Momentum weakened further as price rolled over from the mid range and slid toward the 0.00000440 area. Selling pressure then increased quickly.
A long red candle pushed PEPE below short term support, triggering stops and forcing a fast move lower.
This drop marked a clear breakdown rather than a slow grind, which explains the sudden expansion in volume near the lows.
After the sell off, price briefly flushed toward the 0.00000400 zone before bouncing. That rebound was technical, not impulsive.
Buyers stepped in after the sharp move, but the recovery lacked strength and failed to reclaim the 50 EMA. Price now trades well below that average, which keeps the broader short term structure bearish despite the bounce.
The RSI supports this view. Momentum dipped close to oversold during the sell off, then turned higher as price rebounded. However, RSI remains below the neutral 50 level, showing that bullish momentum has not reset. This signals relief rather than trend reversal.
In short, PEPE recently transitioned from consolidation into breakdown. The bounce that followed reflects short term stabilization after forced selling, but price still sits under key resistance.
Until PEPE reclaims the 50 EMA with strength, recent action points to a corrective rebound within a broader bearish phase rather than a confirmed trend change.
PEPE Downtrend Holds as Price Bases Near Support
Pepe Whale flagged that PEPE stayed in a clear downtrend for months and only recently started building a small base near the lows.
As a result, the chart reads as weak overall, even though price has started to stabilize in the short term.
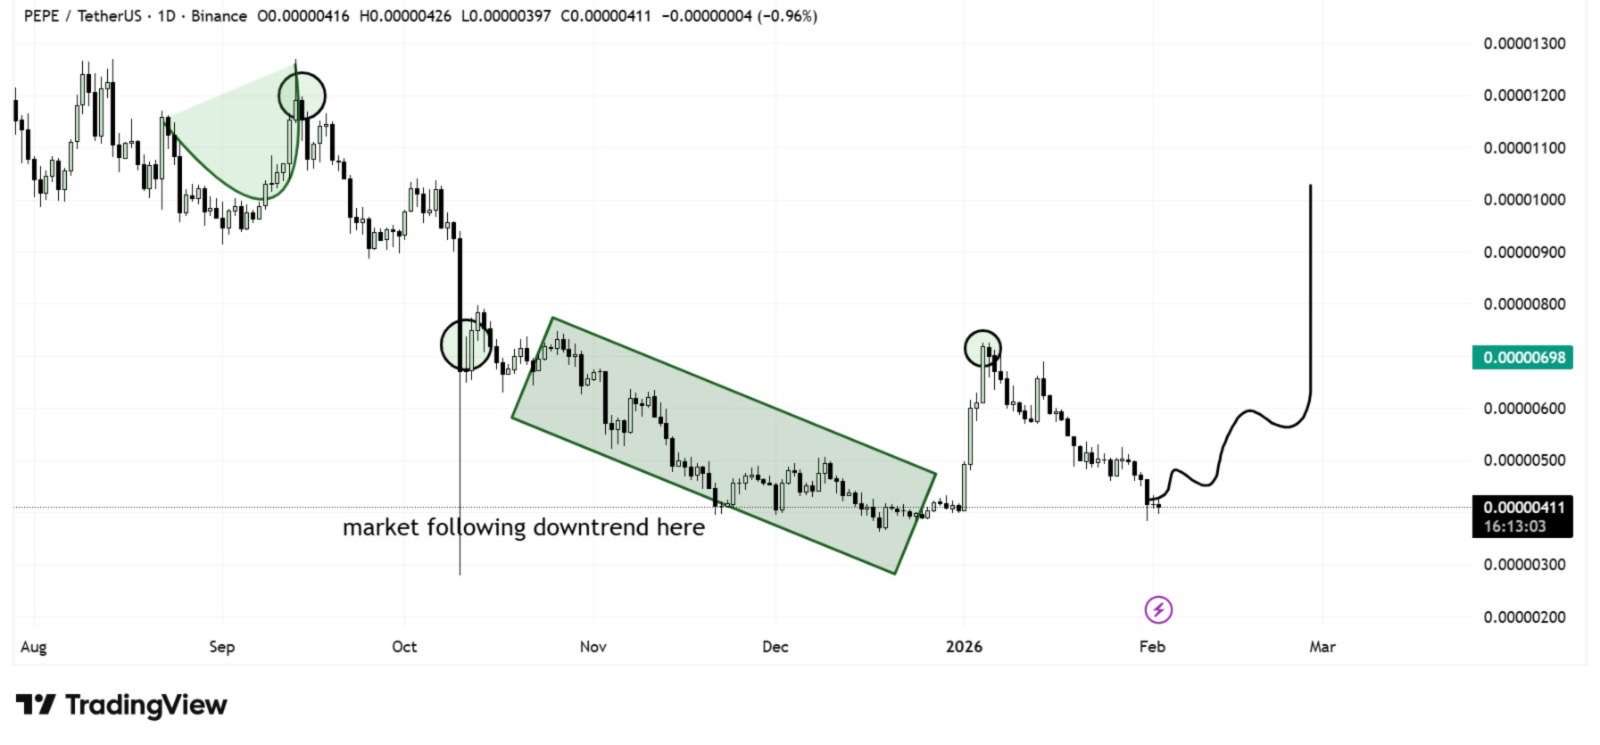
That base matters because it can trigger a bounce if buyers defend the current zone.
However, the chart only shifts to a stronger bullish case if PEPE breaks above the prior spike high. Until that happens, rebounds look like relief moves inside a broader bearish structure.
On the levels, the post marks support near about $0.0000040. If price holds above it, the next upside areas sit around $0.0000055 and then near $0.0000070.
If PEPE loses that support, the downtrend remains intact and the bearish trend stays in control.
Disclosure:This article does not contain investment advice or recommendations. Every investment and trading move involves risk, and readers should conduct their own research when making a decision.
Kriptoworld.com accepts no liability for any errors in the articles or for any financial loss resulting from incorrect information.

Tatevik Avetisyan is an editor at Kriptoworld who covers emerging crypto trends, blockchain innovation, and altcoin developments. She is passionate about breaking down complex stories for a global audience and making digital finance more accessible.
📅 Published: February 3, 2026 • 🕓 Last updated: February 3, 2026
