


Shiba Inu trades near 0.0000085 dollars on the daily chart while it moves inside a narrow, falling channel under a steep downtrend line.
The 50-day exponential moving average sits above price around 0.0000092 dollars and now acts as dynamic resistance.
Stay ahead in the crypto world – follow us on X for the latest updates, insights, and trends!🚀
Each bounce over the past two months has stalled at lower highs, so the structure still favors the downside.
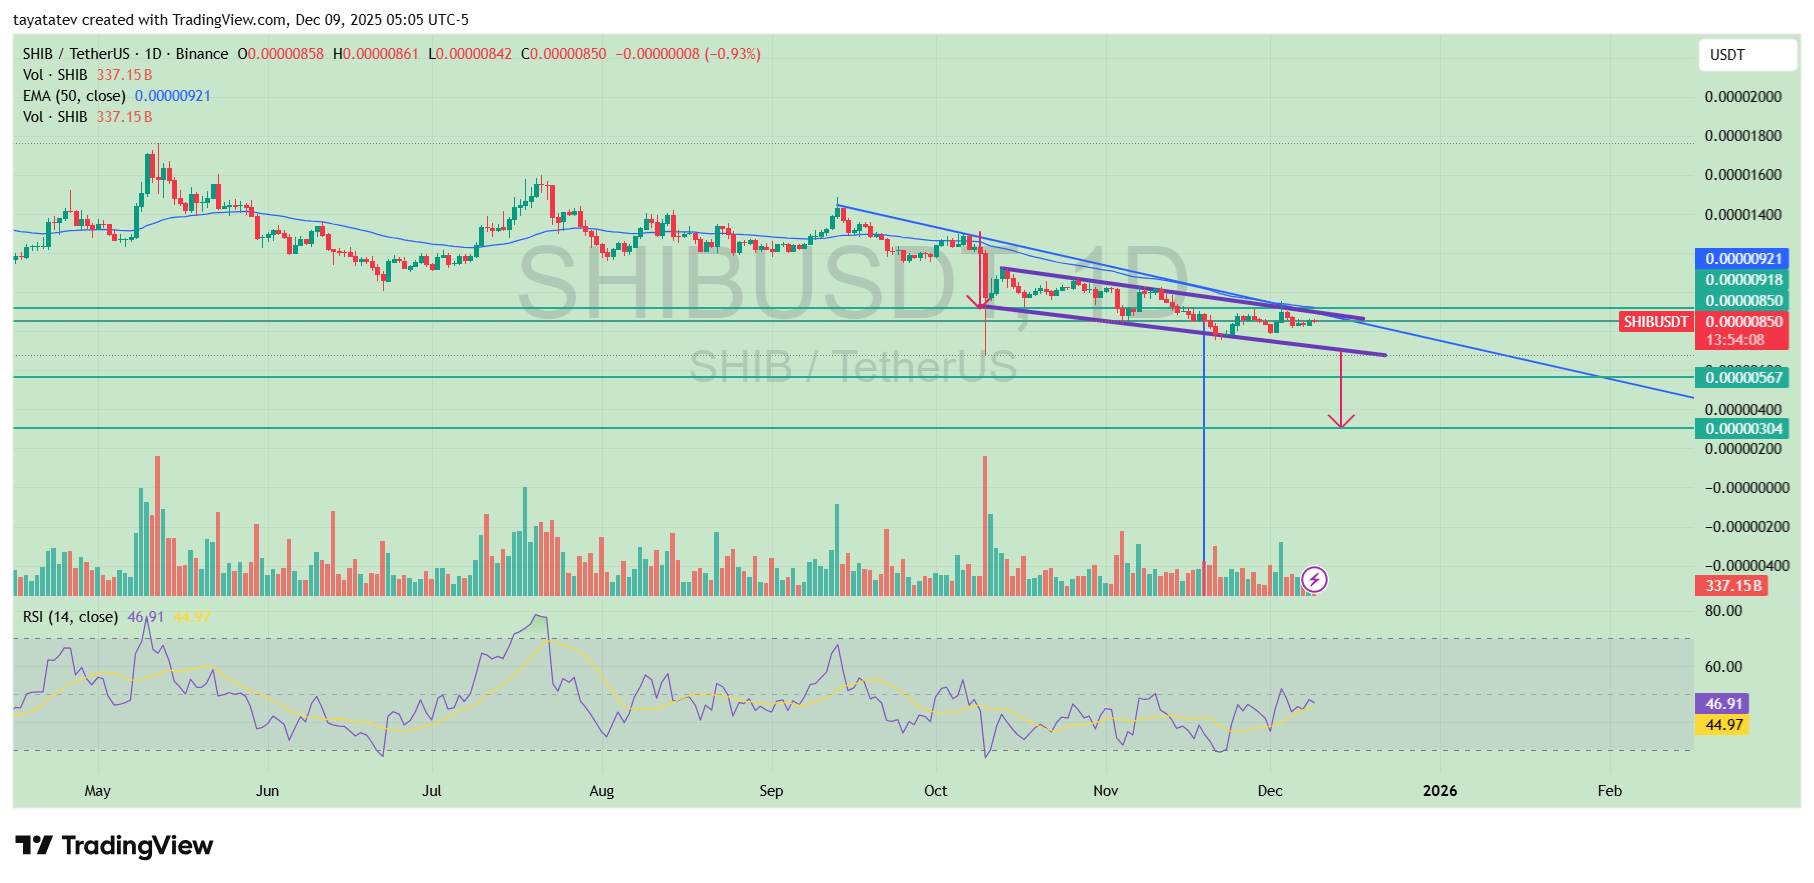
A bearish flag pattern forms when price consolidates in a small, slightly rising or drifting channel after a sharp drop, then often continues lower by roughly the size of the prior decline.
On this chart, the strong leg down from late September to mid-October created the “flagpole.”
Since then, SHIB has traded inside a descending flag that is marked by parallel trendlines capping both rallies and pullbacks. Volume has generally cooled during this consolidation, which fits the textbook behavior of a flag.
Right now, the lower boundary of the flag runs just above the 0.0000070 dollar area, with several candles already testing that zone.
If SHIB closes decisively below this support and the blue downtrend line, and if volume expands on the break, the bearish flag would confirm.
In that case, the measured move from the flagpole points to a possible drop of about 57 percent from the current level, projecting a downside target near 0.0000037 dollars.
That area lines up with an older support band between roughly 0.0000040 and 0.0000030 dollars on the chart.
Momentum indicators also lean cautious. The daily relative strength index hovers in the mid-40s, which shows weak buying pressure even after brief intraday rebounds.
Each RSI recovery in recent weeks has rolled over before reaching overbought territory, so sellers continue to defend rallies.
As long as RSI stays below 50 and price remains trapped under the flag’s upper trendline and the 50-day EMA, the path of least resistance stays lower.
However, if SHIB manages to reclaim the upper boundary of the flag and close back above the 50-day EMA with stronger volume, that would weaken the bearish pattern.
Until that happens, the chart structure signals that a confirmed breakdown could open room toward the 0.0000037 dollar region, matching the projected 57 percent move from today’s price.
Shiba Inu Sees Sharp Spike in Whale Activity as 1.06T SHIB Move to Exchanges
Shiba Inu recorded its strongest whale activity in six months after large holders moved a significant share of tokens to centralized exchanges.
Onchain data from Santiment show 406 whale transactions worth more than 100,000 dollars each taking place within a short window.
At the same time, exchanges saw net inflows of roughly 1.06 trillion SHIB in 24 hours.
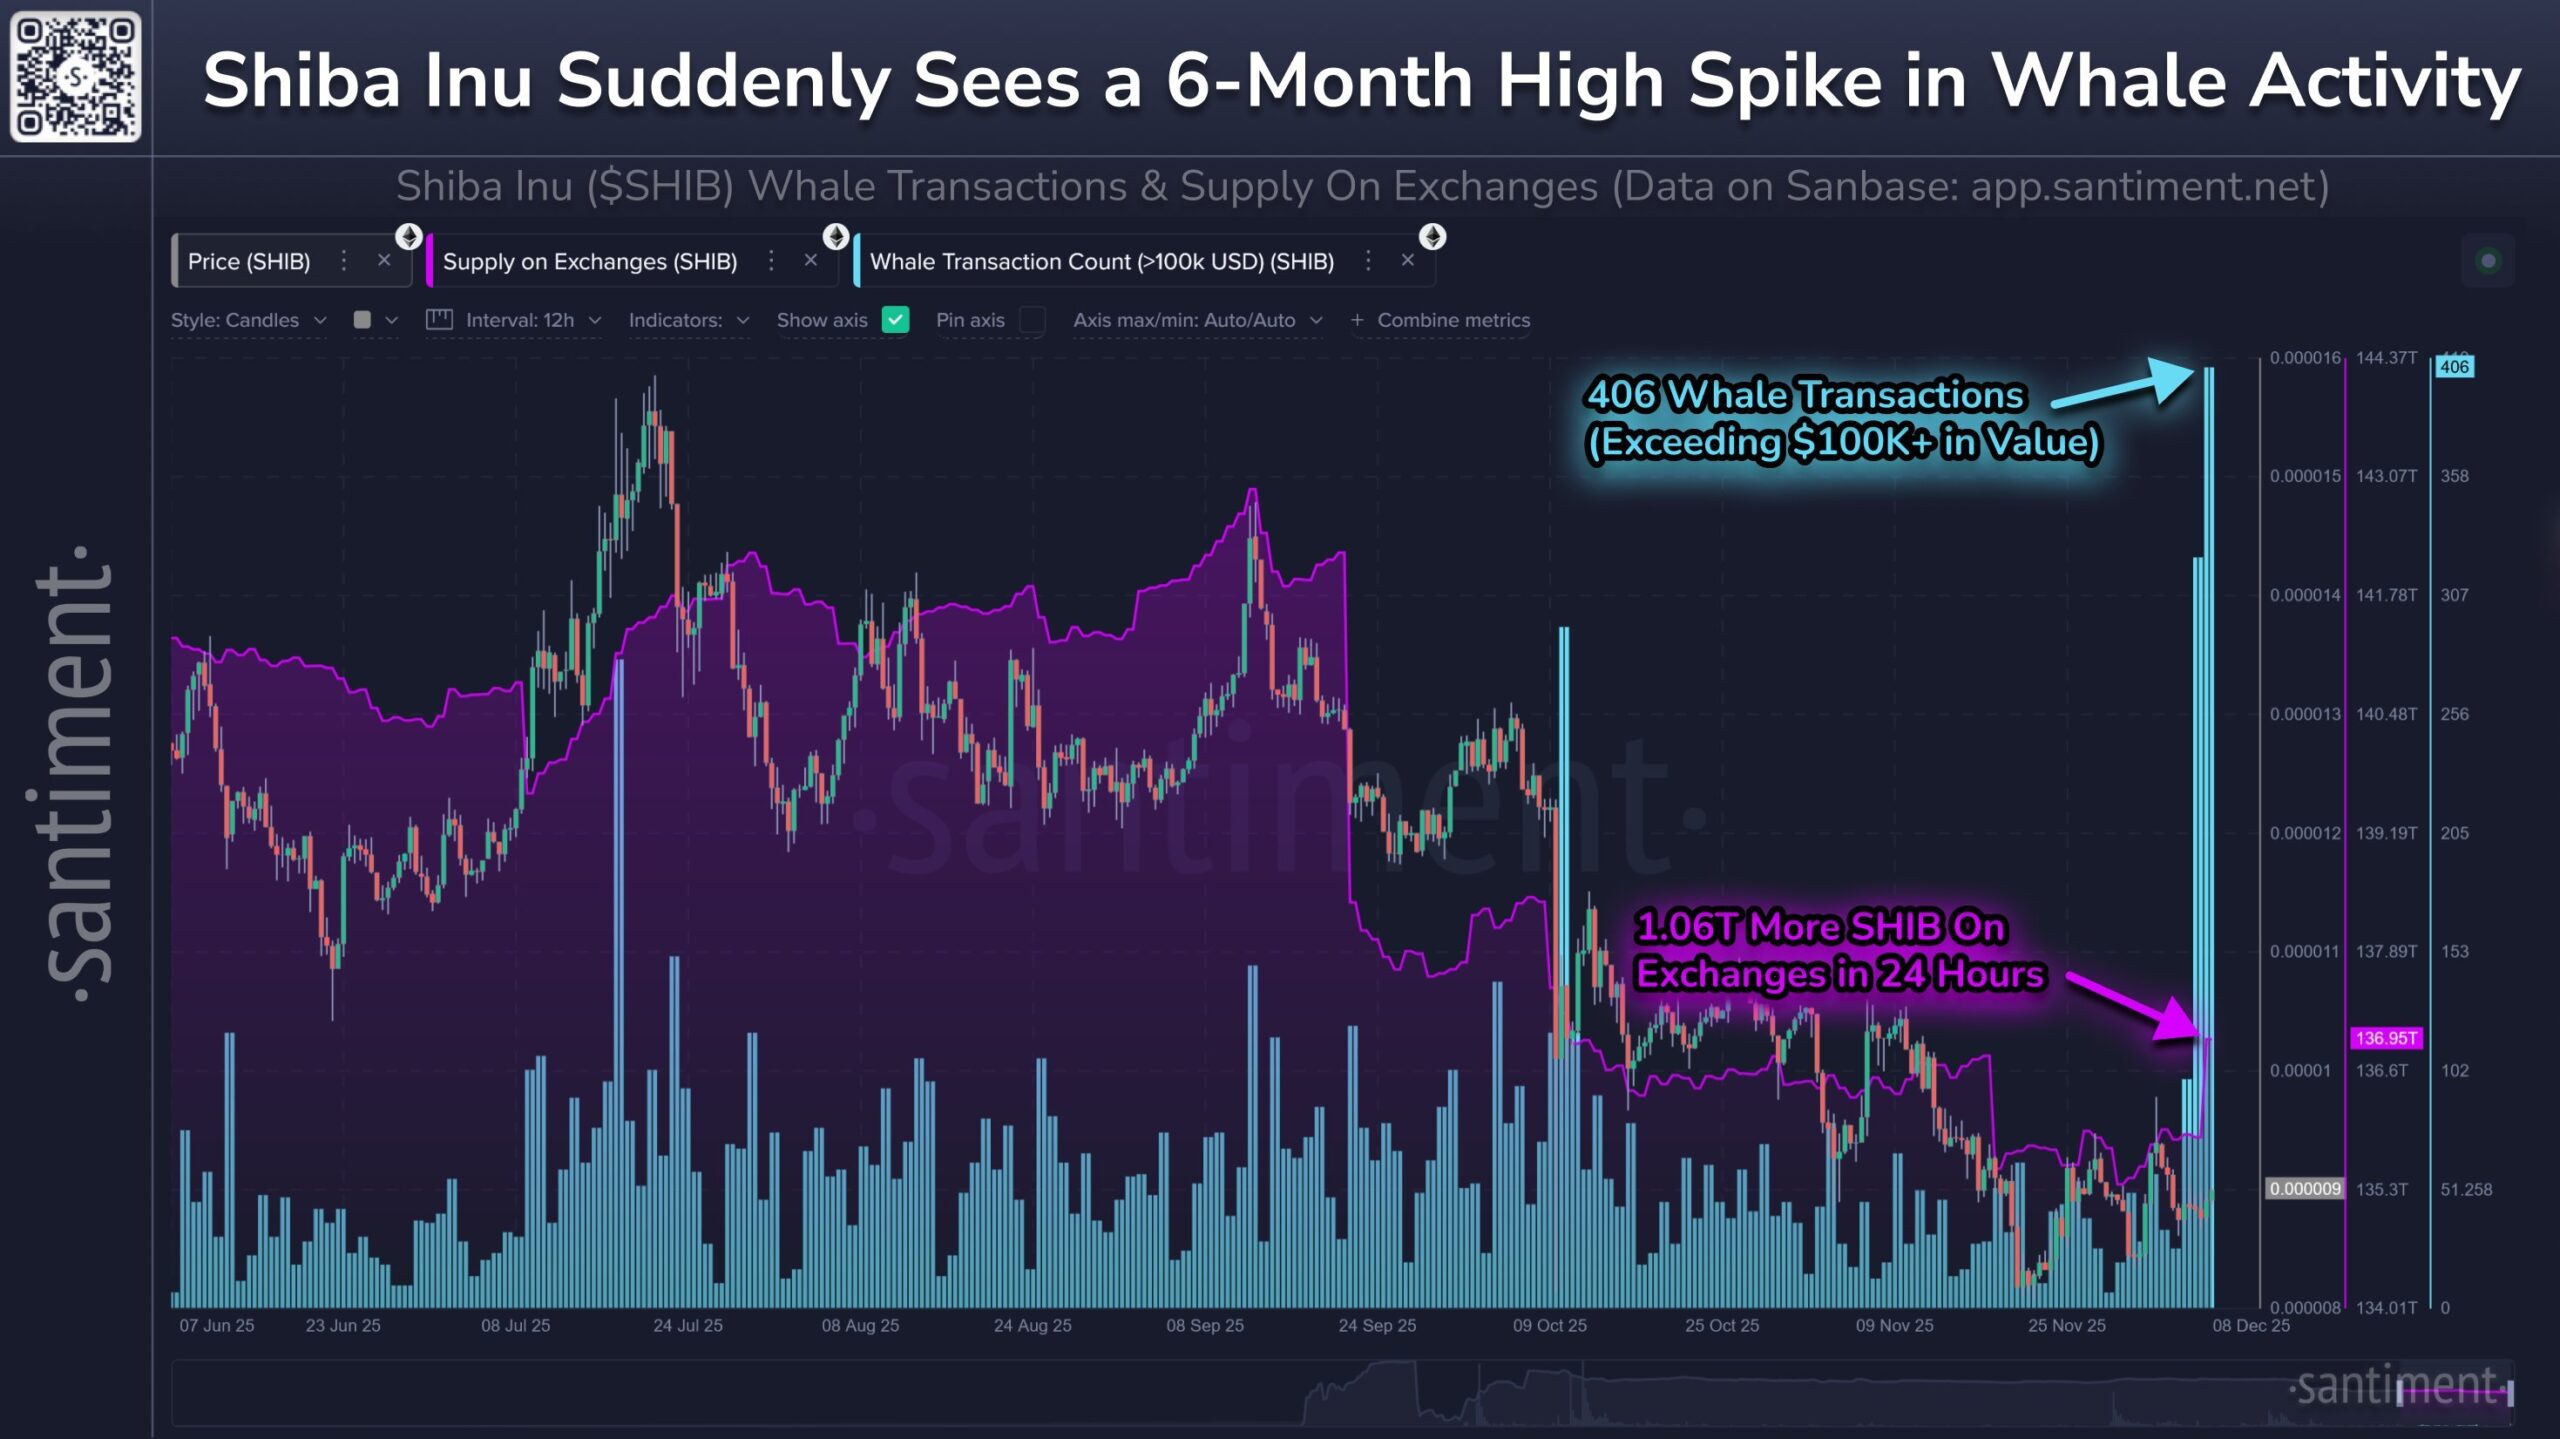
The whale-transaction count chart shows a sudden vertical surge, marking the highest cluster of large-value transfers since June.
These spikes often flag major repositioning by large holders as they adjust exposure across trading venues.
The data also highlight a simultaneous increase in exchange supply, with the purple line on the chart rising from about 135 trillion SHIB to more than 136.9 trillion SHIB.
The inflow suggests more tokens are now available for immediate trading. On earlier occasions, this pattern lined up with periods of sharper intraday swings as markets responded to higher supply and large-sized wallet movements.
While the chart does not specify the intent behind the transfers, the scale of activity indicates notable repositioning by large holders.
Exchange volumes also climbed during the same period. Bars at the bottom of the chart show stronger settlement activity across several hours as SHIB’s price fluctuated around previous support levels.
The combination of whale spikes and exchange inflows historically precedes larger price ranges, according to Santiment’s past observations across similar setups.
Shiba Inu remains among the most actively tracked assets in terms of inflows and large-wallet behavior.
The latest data point again underscores how sudden shifts in supply on exchanges can influence short-term volatility when paired with heavy transaction clusters.
Disclosure:This article does not contain investment advice or recommendations. Every investment and trading move involves risk, and readers should conduct their own research when making a decision.
Kriptoworld.com accepts no liability for any errors in the articles or for any financial loss resulting from incorrect information.

Tatevik Avetisyan is an editor at Kriptoworld who covers emerging crypto trends, blockchain innovation, and altcoin developments. She is passionate about breaking down complex stories for a global audience and making digital finance more accessible.
📅 Published: December 9, 2025 • 🕓 Last updated: December 9, 2025
