


Solana fell to about $82 on the daily SOL/USD chart from Coinbase on Feb. 11, extending a months-long decline and keeping price below the 50-day exponential moving average near $116. As a result, the broader structure remains a downtrend. The latest selloff followed a failed rebound that stalled near the declining average, and therefore sellers kept control as price pushed to fresh local lows.
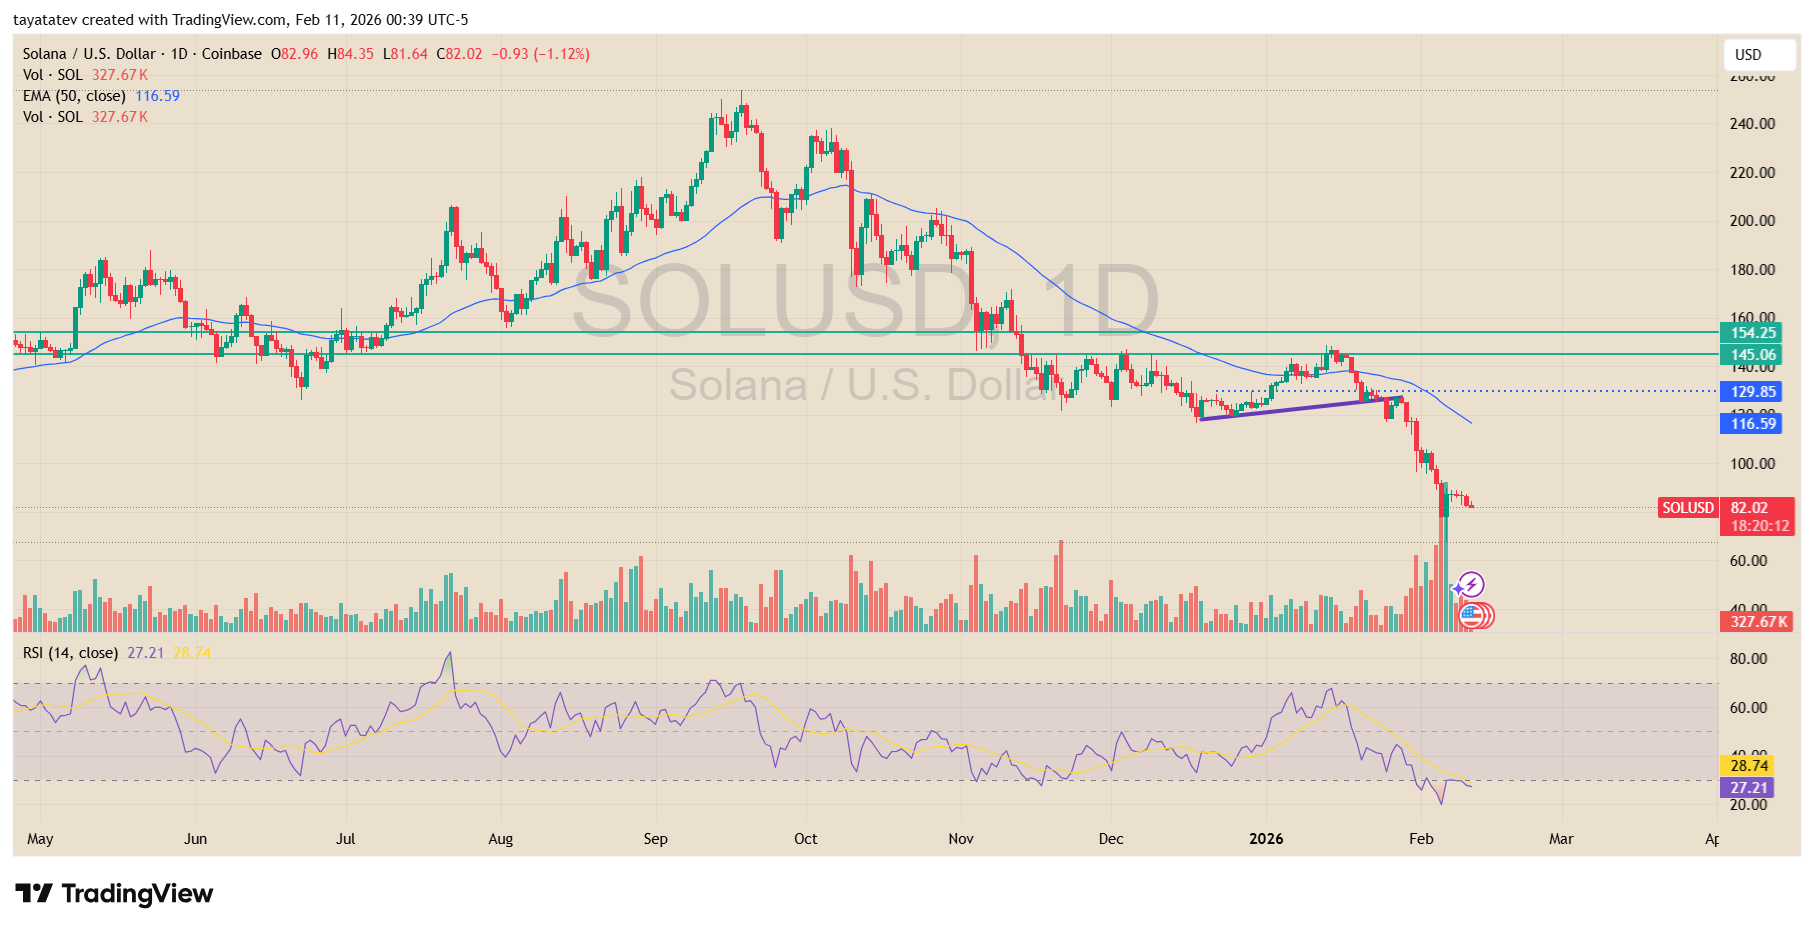
At the same time, the chart shows a prior support zone near the mid-$120s that flipped into resistance. Price also broke down from a short rising base formed in late January, which confirmed weakness after the bounce failed to reclaim the 50-day EMA. In addition, volume expanded during the breakdown, which points to stronger participation on the sell side and reinforces the downside bias.
Momentum indicators echo the pressure. The 14-period RSI on the daily timeframe dropped toward the high-20s, which signals heavy selling pressure after the breakdown. However, oversold readings alone do not mark a turn. For trend conditions to change, price needs to climb back above the green resistance band around the mid-$150s and hold there. That level aligns with former support and now acts as a ceiling. A sustained reclaim would signal that buyers have regained control and would help confirm a reversal. Until price regains that zone and the 50-day EMA, the downtrend stays intact and rallies remain corrective.
Solana chart shows corrective ABC inside falling channel, analyst flags a “reaction” zone
A Solana perpetual futures chart shared by X user The Penguin (@ThePenguinXBT) frames the move from the highs as a clean corrective ABC decline and keeps price action contained inside a downward sloping channel on the three day timeframe. The snapshot plots a series of lower highs under a long falling ceiling and shows the latest leg down pressing into the channel’s lower boundary, which the analyst treats as the key area for the next decision.
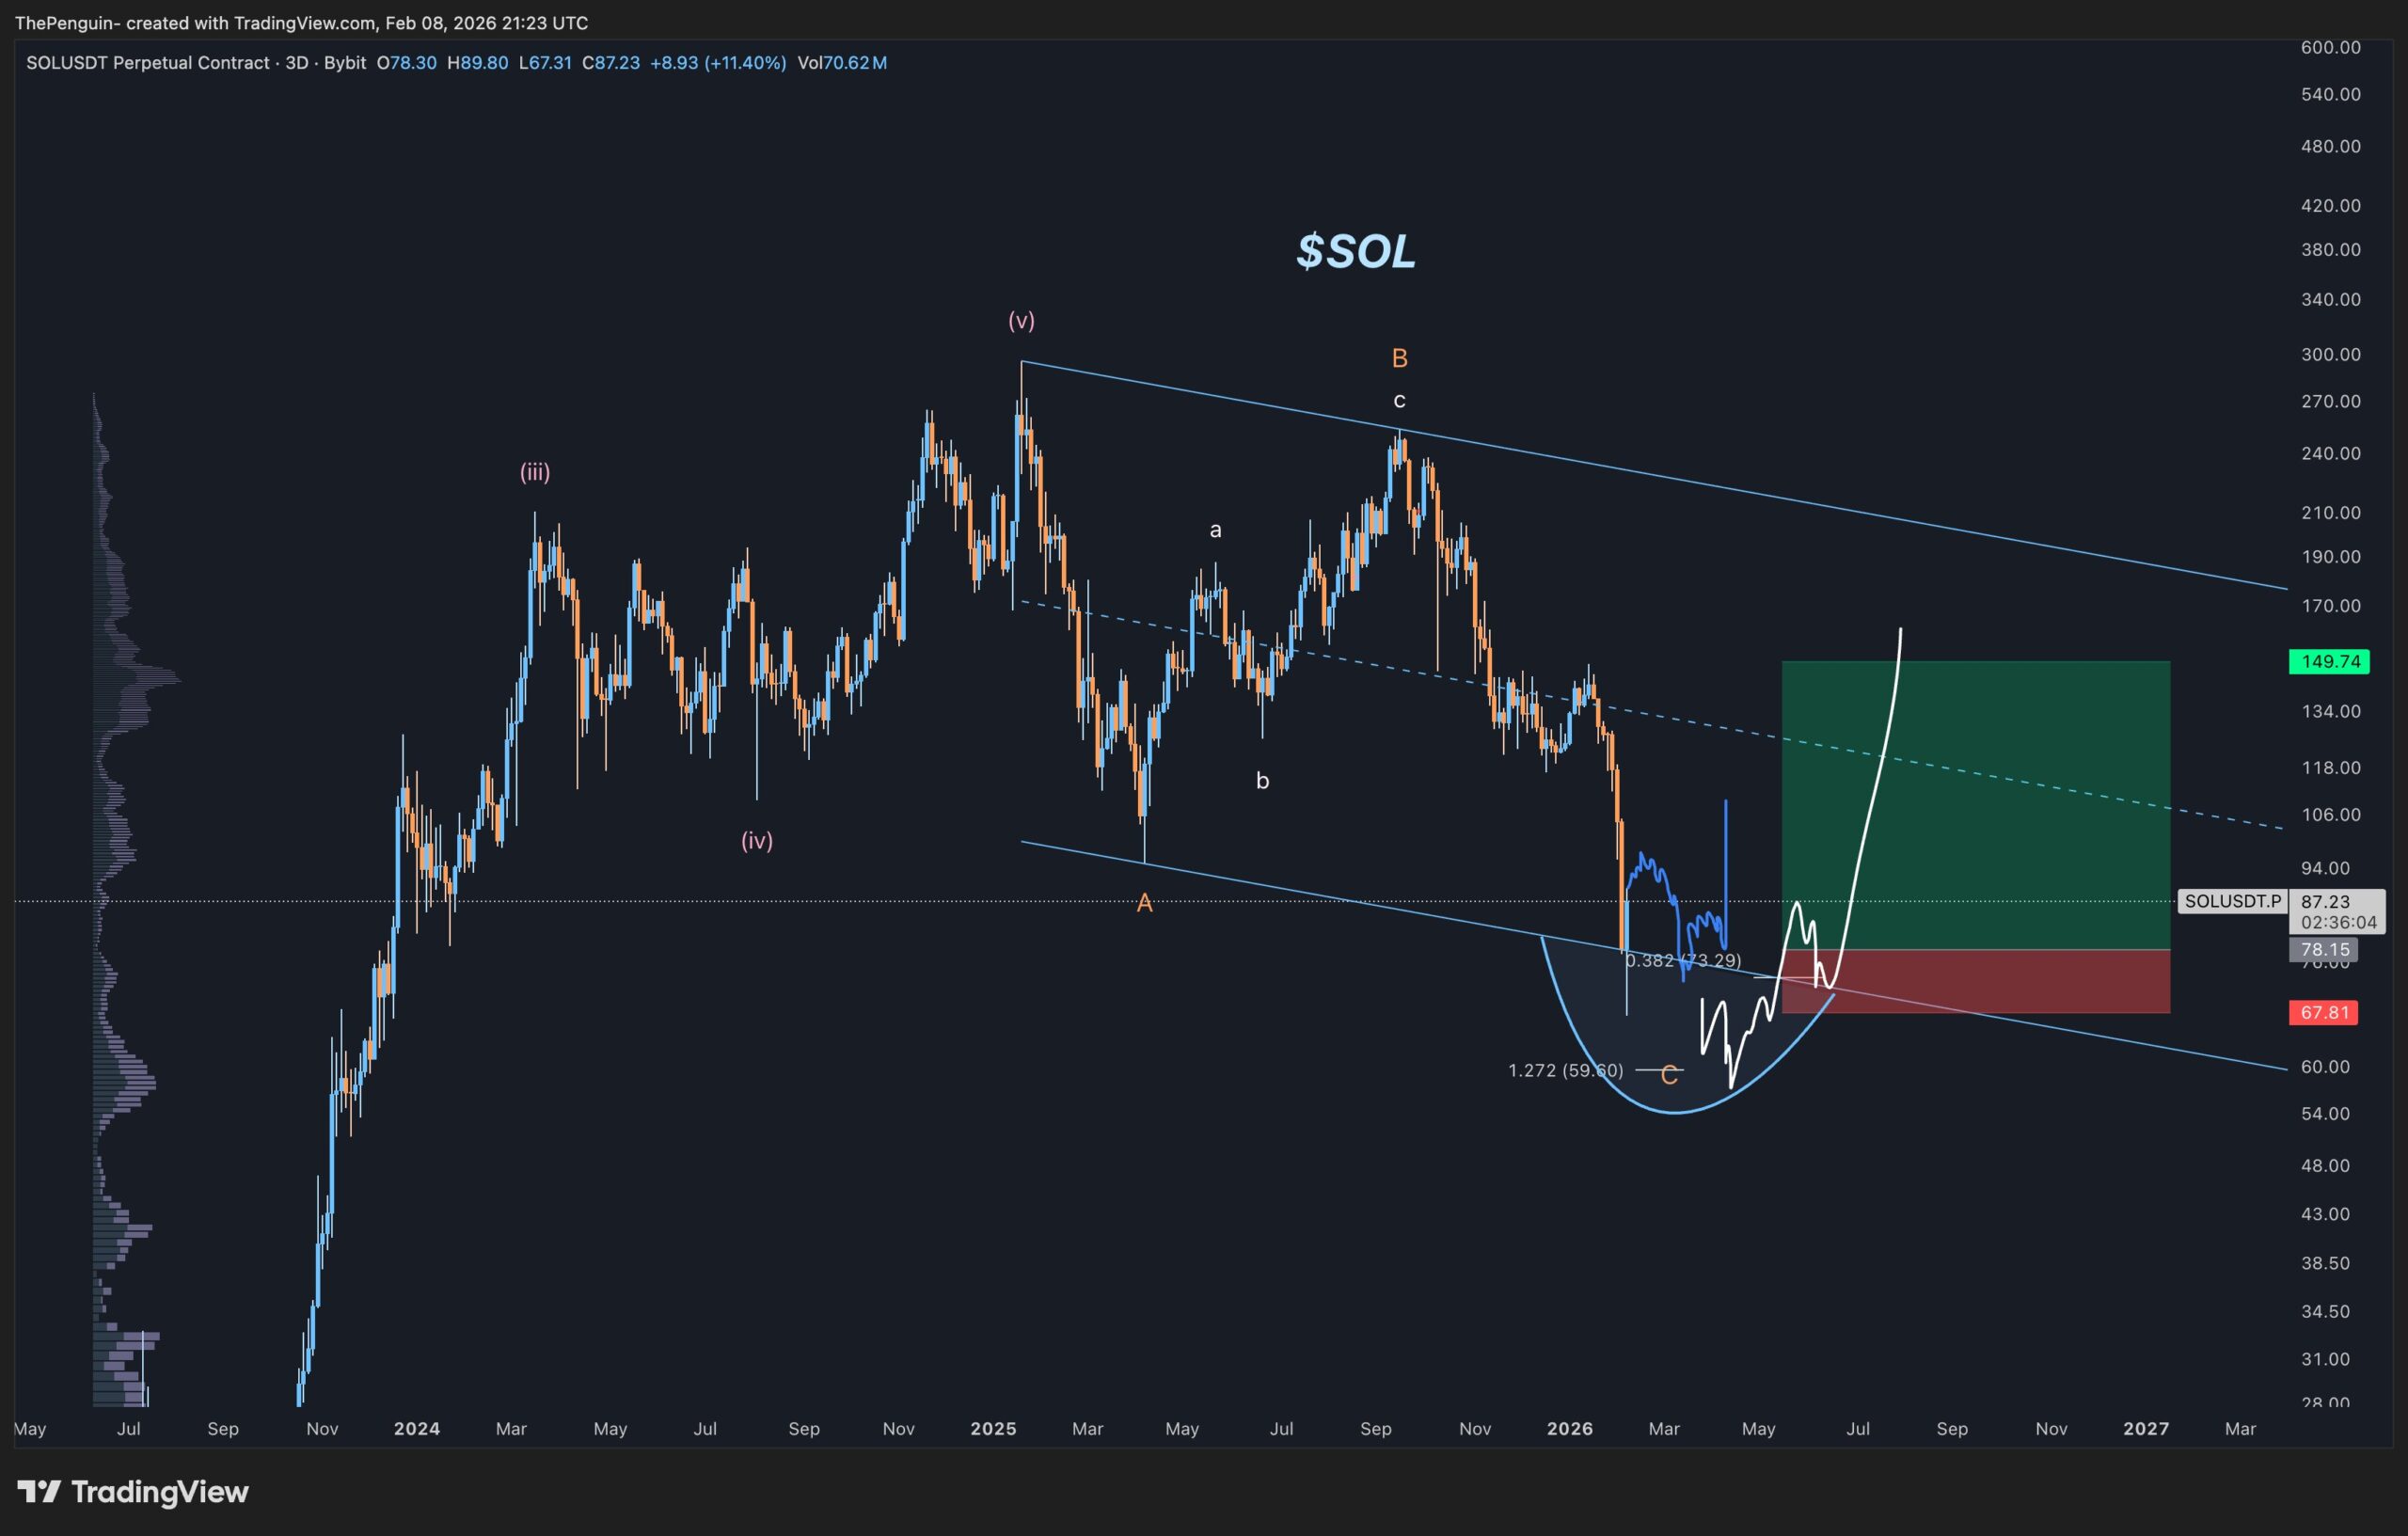
The chart marks a potential base forming near the lower rail, with Fibonacci references drawn around 0.382 near 73.29 and an extension label near 59.60. A boxed setup on the right maps a rebound path that first reclaims the prior breakdown area and then pushes into a higher resistance band, while a red risk zone sits below the local floor near 67.81. As a result, the structure emphasizes whether the market can hold the channel support before any larger recovery attempt develops.
In the accompanying post, The Penguin said he stayed bearish near the top but has turned bullish as the correction matures. However, he tied follow through to how price “reacts” at support, describing the trade as conditional. He wrote that a hold would support a long bias, while a failure would keep him out, and he described the setup as one of the “cleanest” short and medium term charts on his watchlist.
Disclosure:This article does not contain investment advice or recommendations. Every investment and trading move involves risk, and readers should conduct their own research when making a decision.
Kriptoworld.com accepts no liability for any errors in the articles or for any financial loss resulting from incorrect information.

Tatevik Avetisyan is an editor at Kriptoworld who covers emerging crypto trends, blockchain innovation, and altcoin developments. She is passionate about breaking down complex stories for a global audience and making digital finance more accessible.
📅 Published: February 11, 2026 • 🕓 Last updated: February 12, 2026
