


Solana traded near $84.94 on the 4 hour SOLUSD chart from Coinbase on Feb. 18, according to TradingView data.
Price stayed below the 50 period EMA near $85.80, which capped short term rebounds.
Stay ahead in the crypto world – follow us on X for the latest updates, insights, and trends!🚀
As a result, SOL remained under near term resistance after a sharp decline from the $145 area earlier this month.
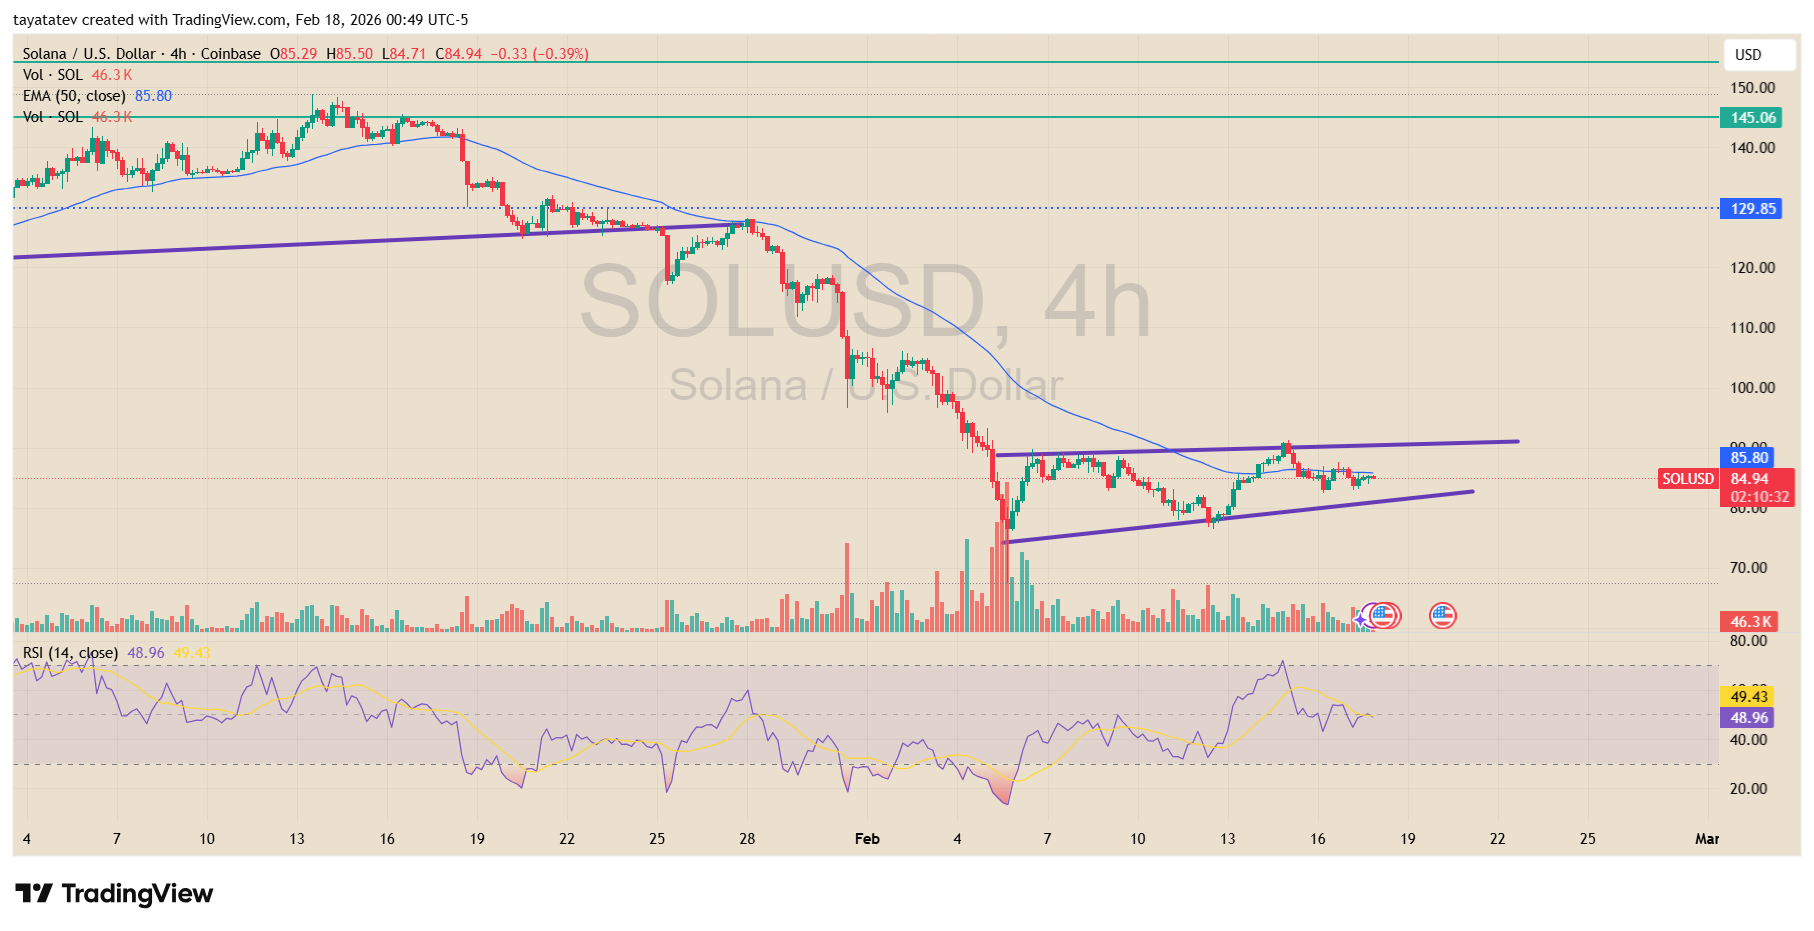
Selling pressure slowed after the early February drop. Since then, price has moved inside a rising wedge, marked by higher lows and rising trendline support.
At the same time, the upper wedge boundary limited upside moves near the $88 to $90 zone.
This structure often appears during corrective phases after strong declines. However, direction remains unclear until price breaks out of the wedge.
Volume spiked during the selloff that pushed SOL below $90. After that move, volume eased as price compressed inside the wedge. This shift points to reduced momentum during consolidation.
Meanwhile, the 50 period EMA continues to slope downward and sits above price. That alignment shows sellers still control the broader short term trend.
Momentum indicators reflect the same pause. The 14 period RSI hovered near the 49 area, close to the midpoint. Earlier in the month, RSI dipped into lower bands during the selloff.
Since then, it recovered but failed to move into strong bullish territory. As a result, momentum remains neutral while price coils inside the rising wedge.
The next directional signal depends on how price exits this structure. A break above the upper wedge line and the 50 period EMA could open a move toward the $90 to $95 zone, where prior breakdown levels sit.
In contrast, a breakdown below the rising support line could expose the recent base near the mid $70s.
Until either move appears, Solana remains in consolidation, with the rising wedge acting as the main technical reference for short term direction.
Solana price prediction as SOL tests Fibonacci support on daily chart
Solana moved into a previously defined Fibonacci support region on the daily time frame, according to chart data shared by More Crypto Online.
Since November, the working thesis outlined a corrective rally within wave 4, followed by a decline toward the $81.50 region.
That downside target was repeatedly referenced as an ideal level for wave C. The recent drop reached that area, placing price directly inside the projected support zone.
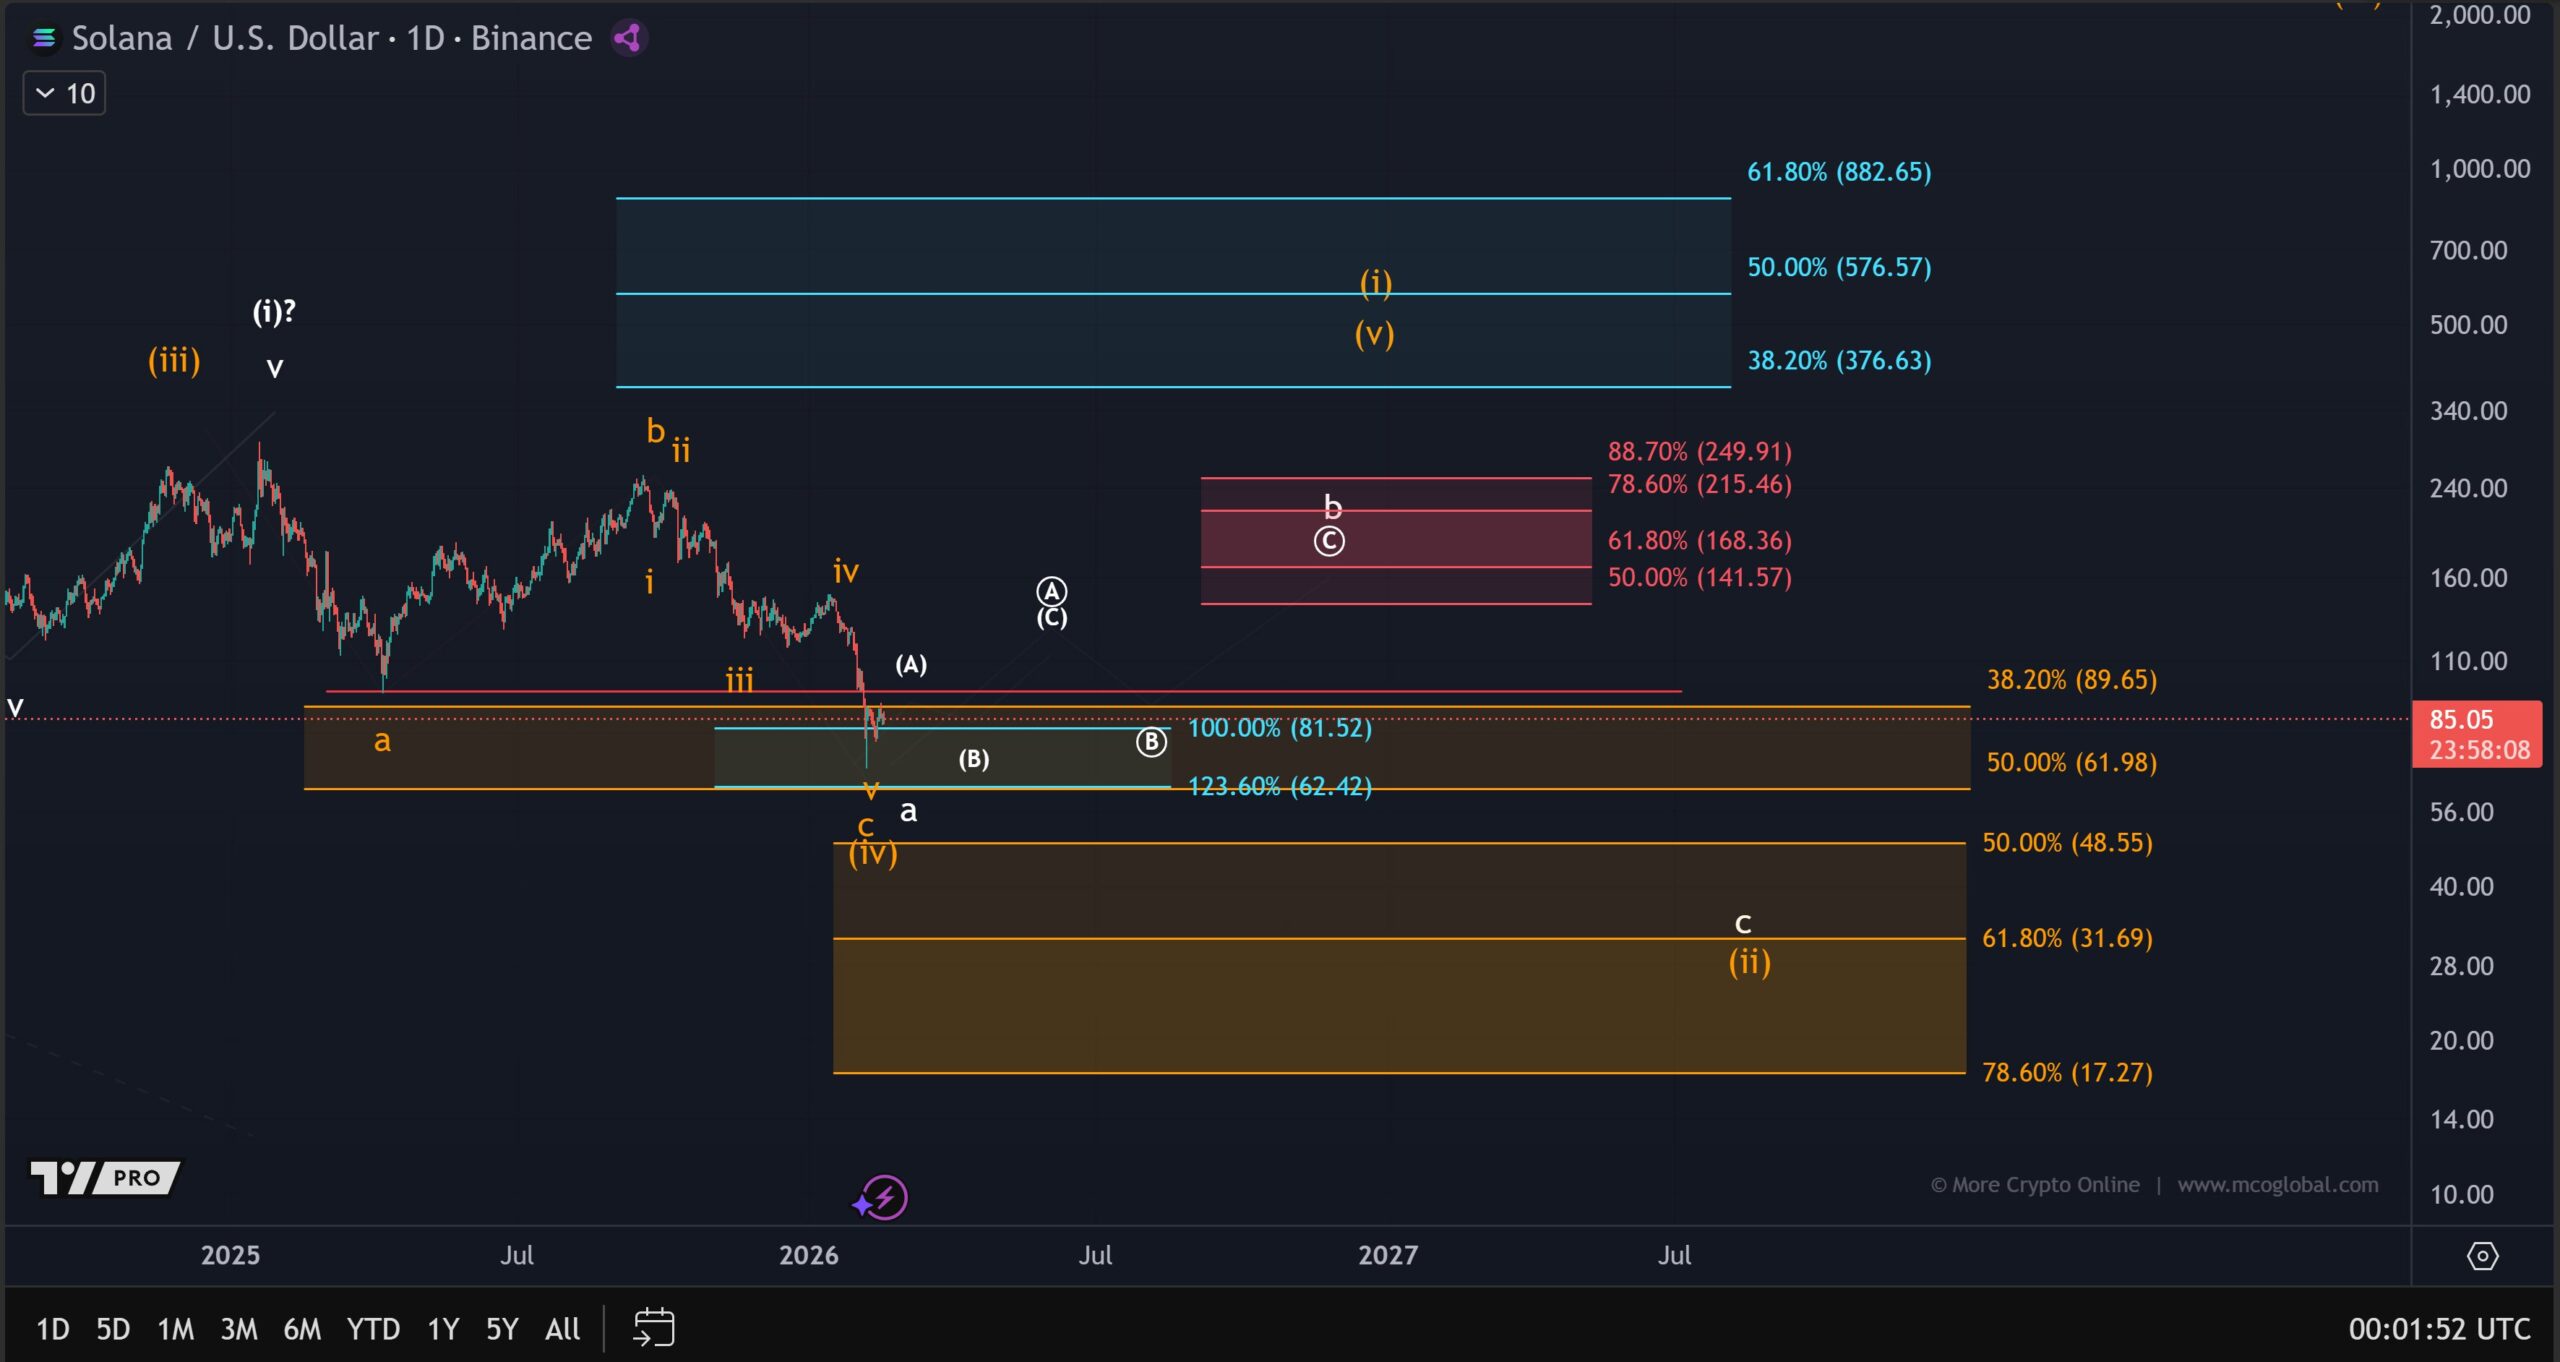
Under the orange scenario on the chart, the decline from the 2025 high counts as an ABC structure that completes a larger wave (iv). In contrast, the white scenario treats the same decline as wave A of a broader corrective phase.
From a wider market structure perspective, the white interpretation currently carries higher probability.
That count allows for a corrective rally from the current support zone, which stretches lower toward the $62 region.
Even so, any upside move is expected to unfold as an ABC structure rather than an impulsive breakout.
The structure does not yet show evidence of strong trend reversal. Although a move toward the January high near $150 remains structurally possible over the coming months, the chart does not confirm a bottom at this stage.
On the lower time frame, the first rally from the February low developed as a three wave move. That formation does not signal impulsive strength.
A potential 1–2 setup is forming, but confirmation remains absent. For the upside structure to gain credibility, price must break above $88 and then clear $91.30.
Until those levels give way, the broader pattern continues to point to a corrective phase rather than a confirmed trend shift.
Disclosure:This article does not contain investment advice or recommendations. Every investment and trading move involves risk, and readers should conduct their own research when making a decision.
Kriptoworld.com accepts no liability for any errors in the articles or for any financial loss resulting from incorrect information.

Tatevik Avetisyan is an editor at Kriptoworld who covers emerging crypto trends, blockchain innovation, and altcoin developments. She is passionate about breaking down complex stories for a global audience and making digital finance more accessible.
📅 Published: February 18, 2026 • 🕓 Last updated: February 18, 2026
