


Solana’s chart is sending mixed signals that could punish traders on the wrong side.
A crowded head-and-shoulders setup and a recycled RSI capitulation level now raise the risk of a sharp break.
Stay ahead in the crypto world – follow us on X for the latest updates, insights, and trends!🚀
Crowd-Watched Solana Pattern Risks Upside “Bear Trap”
Solana sits on a major weekly support zone while traders fixate on a textbook head-and-shoulders pattern.
Analyst CryptoCurb warned that it “would be a real shame” if the formation breaks upward just as short sellers lean into the bearish setup.
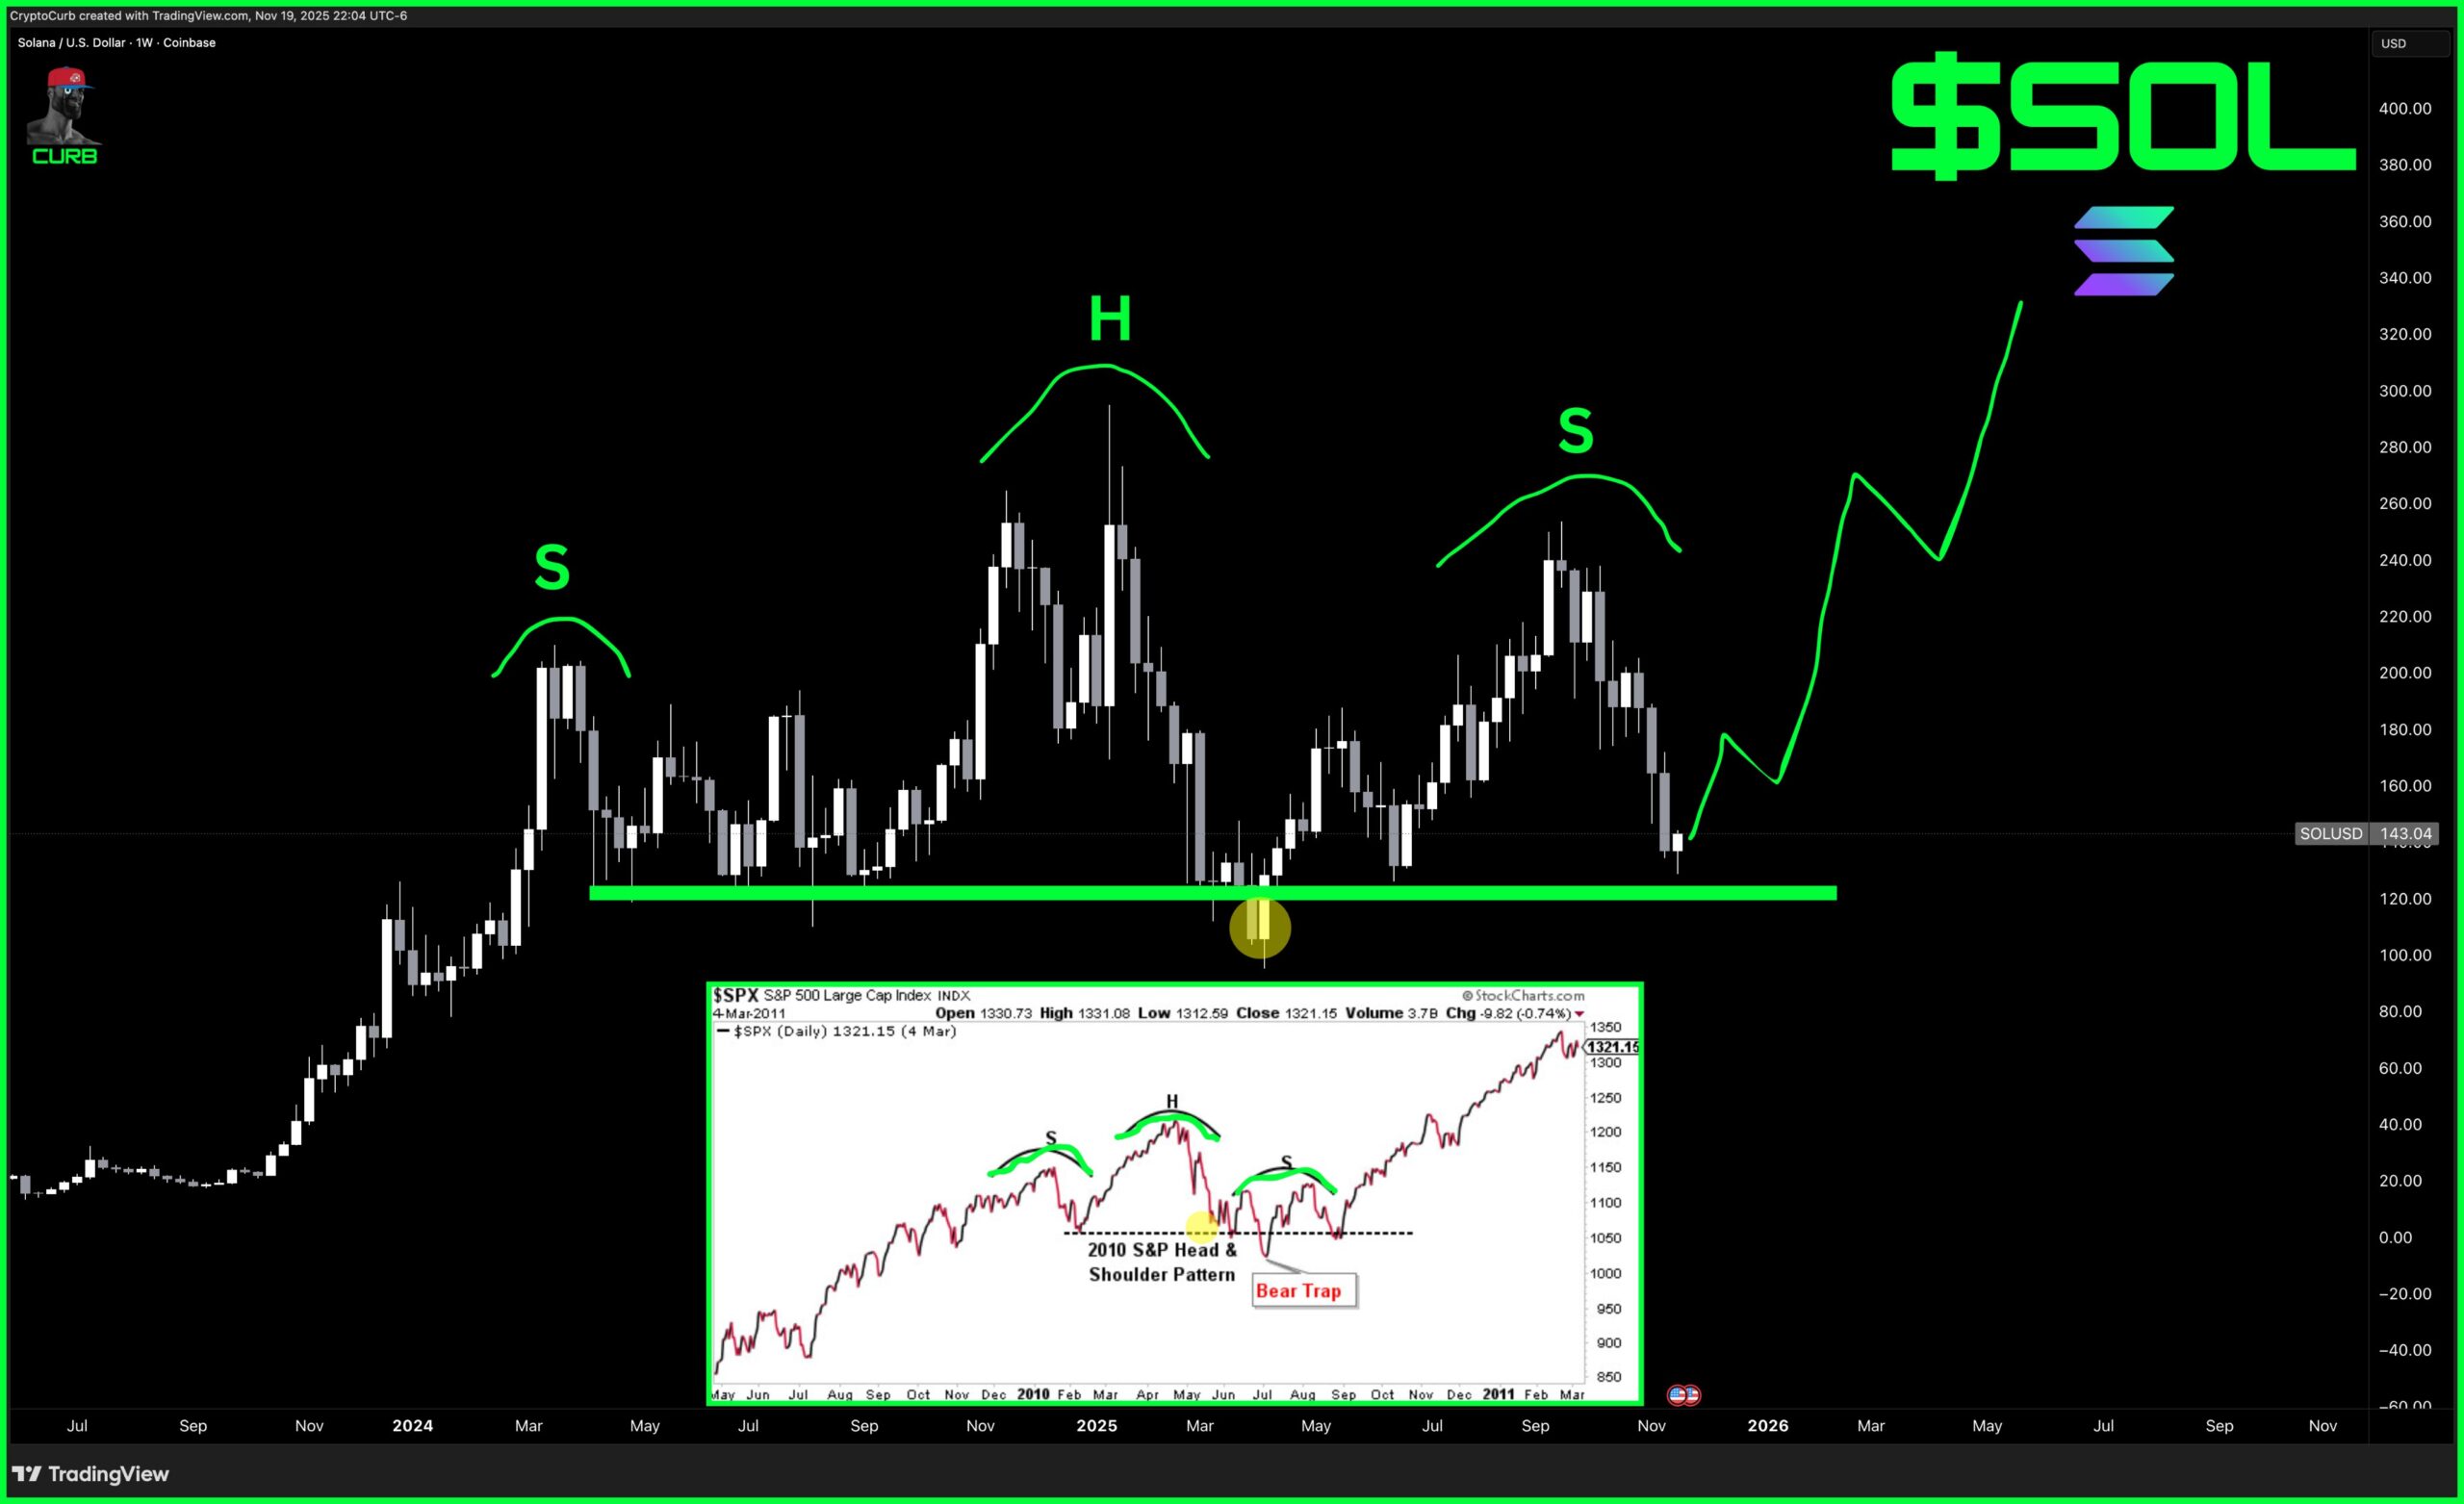
On the weekly SOL/USD chart, price has carved out a left shoulder, head, and right shoulder against a horizontal base near the $130 area.
Many traders view a clean breakdown below that neckline as confirmation of a larger bearish reversal.
However, the chart overlay shows a similar pattern from the 2010 S&P 500 that failed, trapping bears before a sustained rally.
Curb’s comparison highlights the risk that Solana could repeat that script. If the token holds the green support band and turns higher, the invalidated pattern could fuel a squeeze, forcing late shorts to cover.
The sketched projection on the chart outlines a potential move back toward the $260–$320 region if buyers regain control from this support line.
Solana RSI Drops Back to 2023 Capitulation Zone
Solana has fallen to relative-strength levels last seen at its 2023 bottom, when SOL traded near $13, according to WebTrend.
The 3-day chart shows the RSI line touching the same oversold band that preceded the token’s major reversal last cycle.
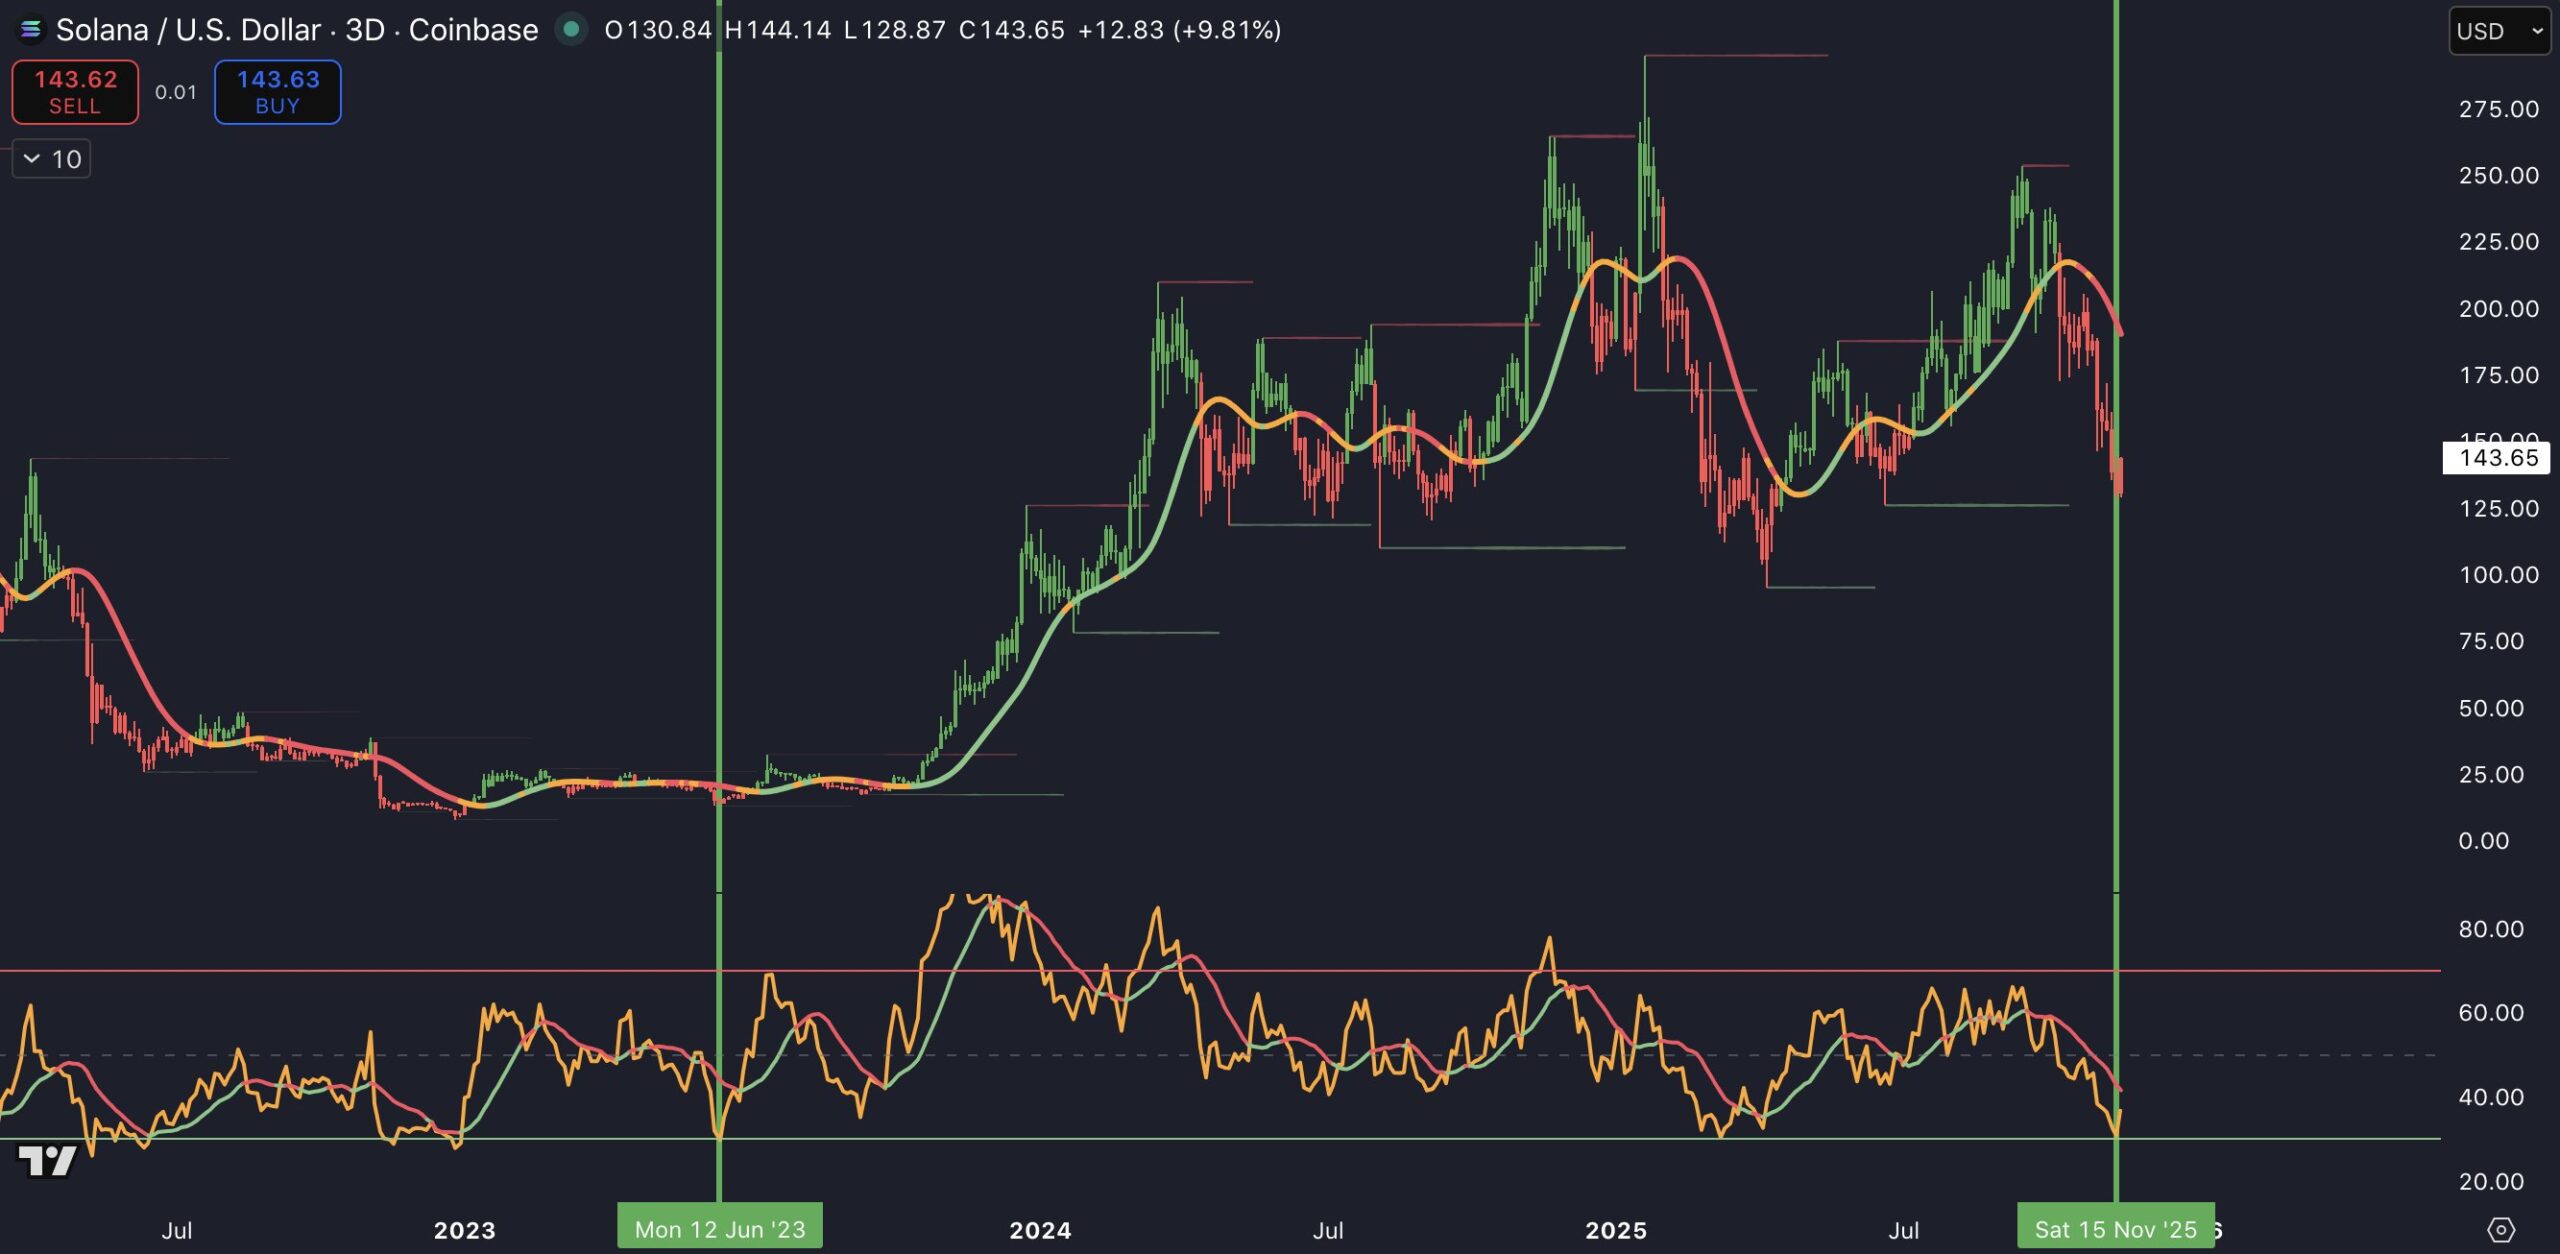
At the same time, SOL changes hands around $143 on Coinbase, far above that prior low.
The divergence between today’s price and the old RSI floor highlights how aggressively momentum has cooled despite Solana holding a much higher level on the chart.
Traders now watch whether this repeated RSI print marks another medium-term bottom or simply signals that selling pressure remains intense.
The previous occurrence in mid-2023 came just before Solana began its long climb from double-digit prices into the current range.
Disclosure:This article does not contain investment advice or recommendations. Every investment and trading move involves risk, and readers should conduct their own research when making a decision.
Kriptoworld.com accepts no liability for any errors in the articles or for any financial loss resulting from incorrect information.

Tatevik Avetisyan is an editor at Kriptoworld who covers emerging crypto trends, blockchain innovation, and altcoin developments. She is passionate about breaking down complex stories for a global audience and making digital finance more accessible.
📅 Published: November 20, 2025 • 🕓 Last updated: November 20, 2025
