


SUI turned higher on Jan. 6, 2026, according to the SUI/USDT daily chart on Binance, marking its first clear upside push after a prolonged decline.
Price closed near $1.97, up roughly 3.8% on the day, after trading between about $1.89 and $1.99.
Stay ahead in the crypto world – follow us on X for the latest updates, insights, and trends!🚀
This daily gain followed several sessions of tight consolidation, signaling a shift in short-term control back toward buyers.
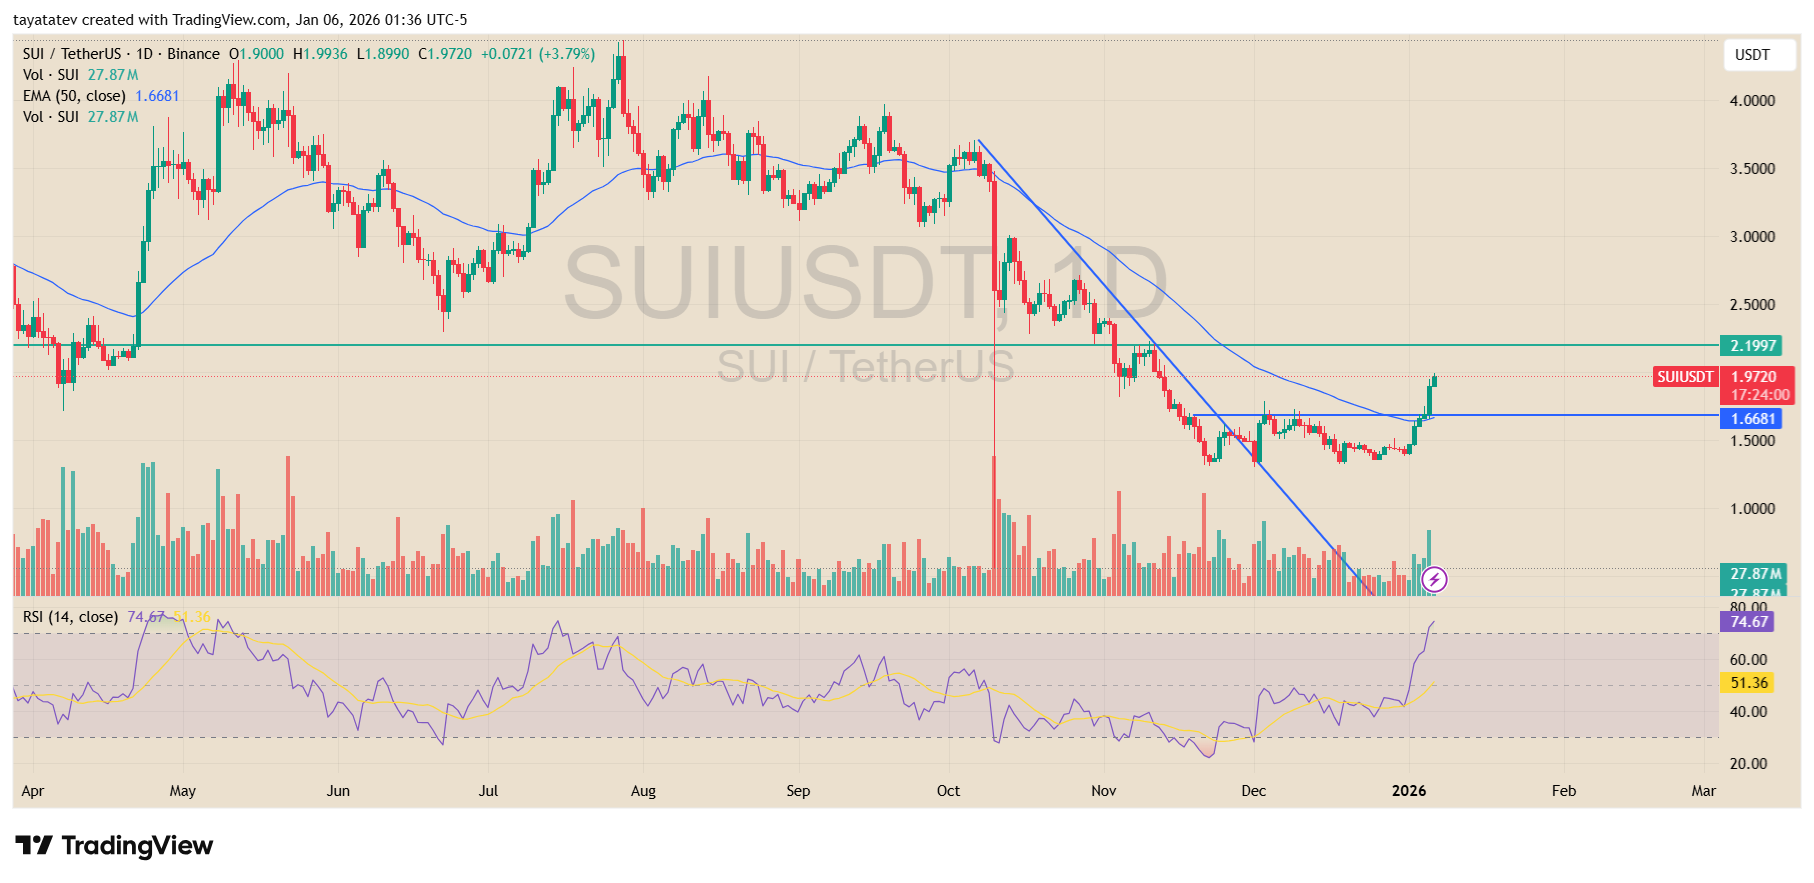
Before this move, SUI spent weeks forming lower highs and lower lows while trading below its 50-day exponential moving average, which sat near $1.67.
However, price reclaimed this moving average and held above it into the daily close. As a result, downside pressure eased, and structure began to stabilize.
At the same time, volume expanded compared with recent sessions, adding weight to the breakout attempt rather than showing a thin bounce.
Momentum indicators also confirmed the change. The RSI (14) surged toward the mid-70s, reflecting strong upside acceleration rather than a weak corrective rally.
Importantly, RSI pushed decisively above its recent range, which had capped momentum through most of December.
This shift suggests buyers are now willing to absorb supply at higher levels, instead of selling into every rally.
However, confirmation still depends on follow-through. Price now sits just below the $2.19 resistance zone, which previously acted as a key support area before the October breakdown.
For the move to qualify as a confirmed reversal rather than a short-lived rebound, SUI needs to push above $2.19 and hold it on a daily closing basis.
A sustained break above that level would flip former resistance into support and signal that the broader trend has shifted back to the upside.
Until then, the current move stands as a strong early reversal attempt, but not yet a fully confirmed trend change.
SUI rebounds from triple bottom as key support flips back to buyers
SUI staged a sharp recovery on Jan. 5, 2026, based on the SUI/USDT 3 day chart on Binance, after bouncing from a clearly defined triple bottom near the $1.40–$1.45 zone.
Price advanced more than 13% over the three day candle, reclaiming ground that had capped upside attempts through late December.
This move marked the strongest upside reaction since the October breakdown phase began.
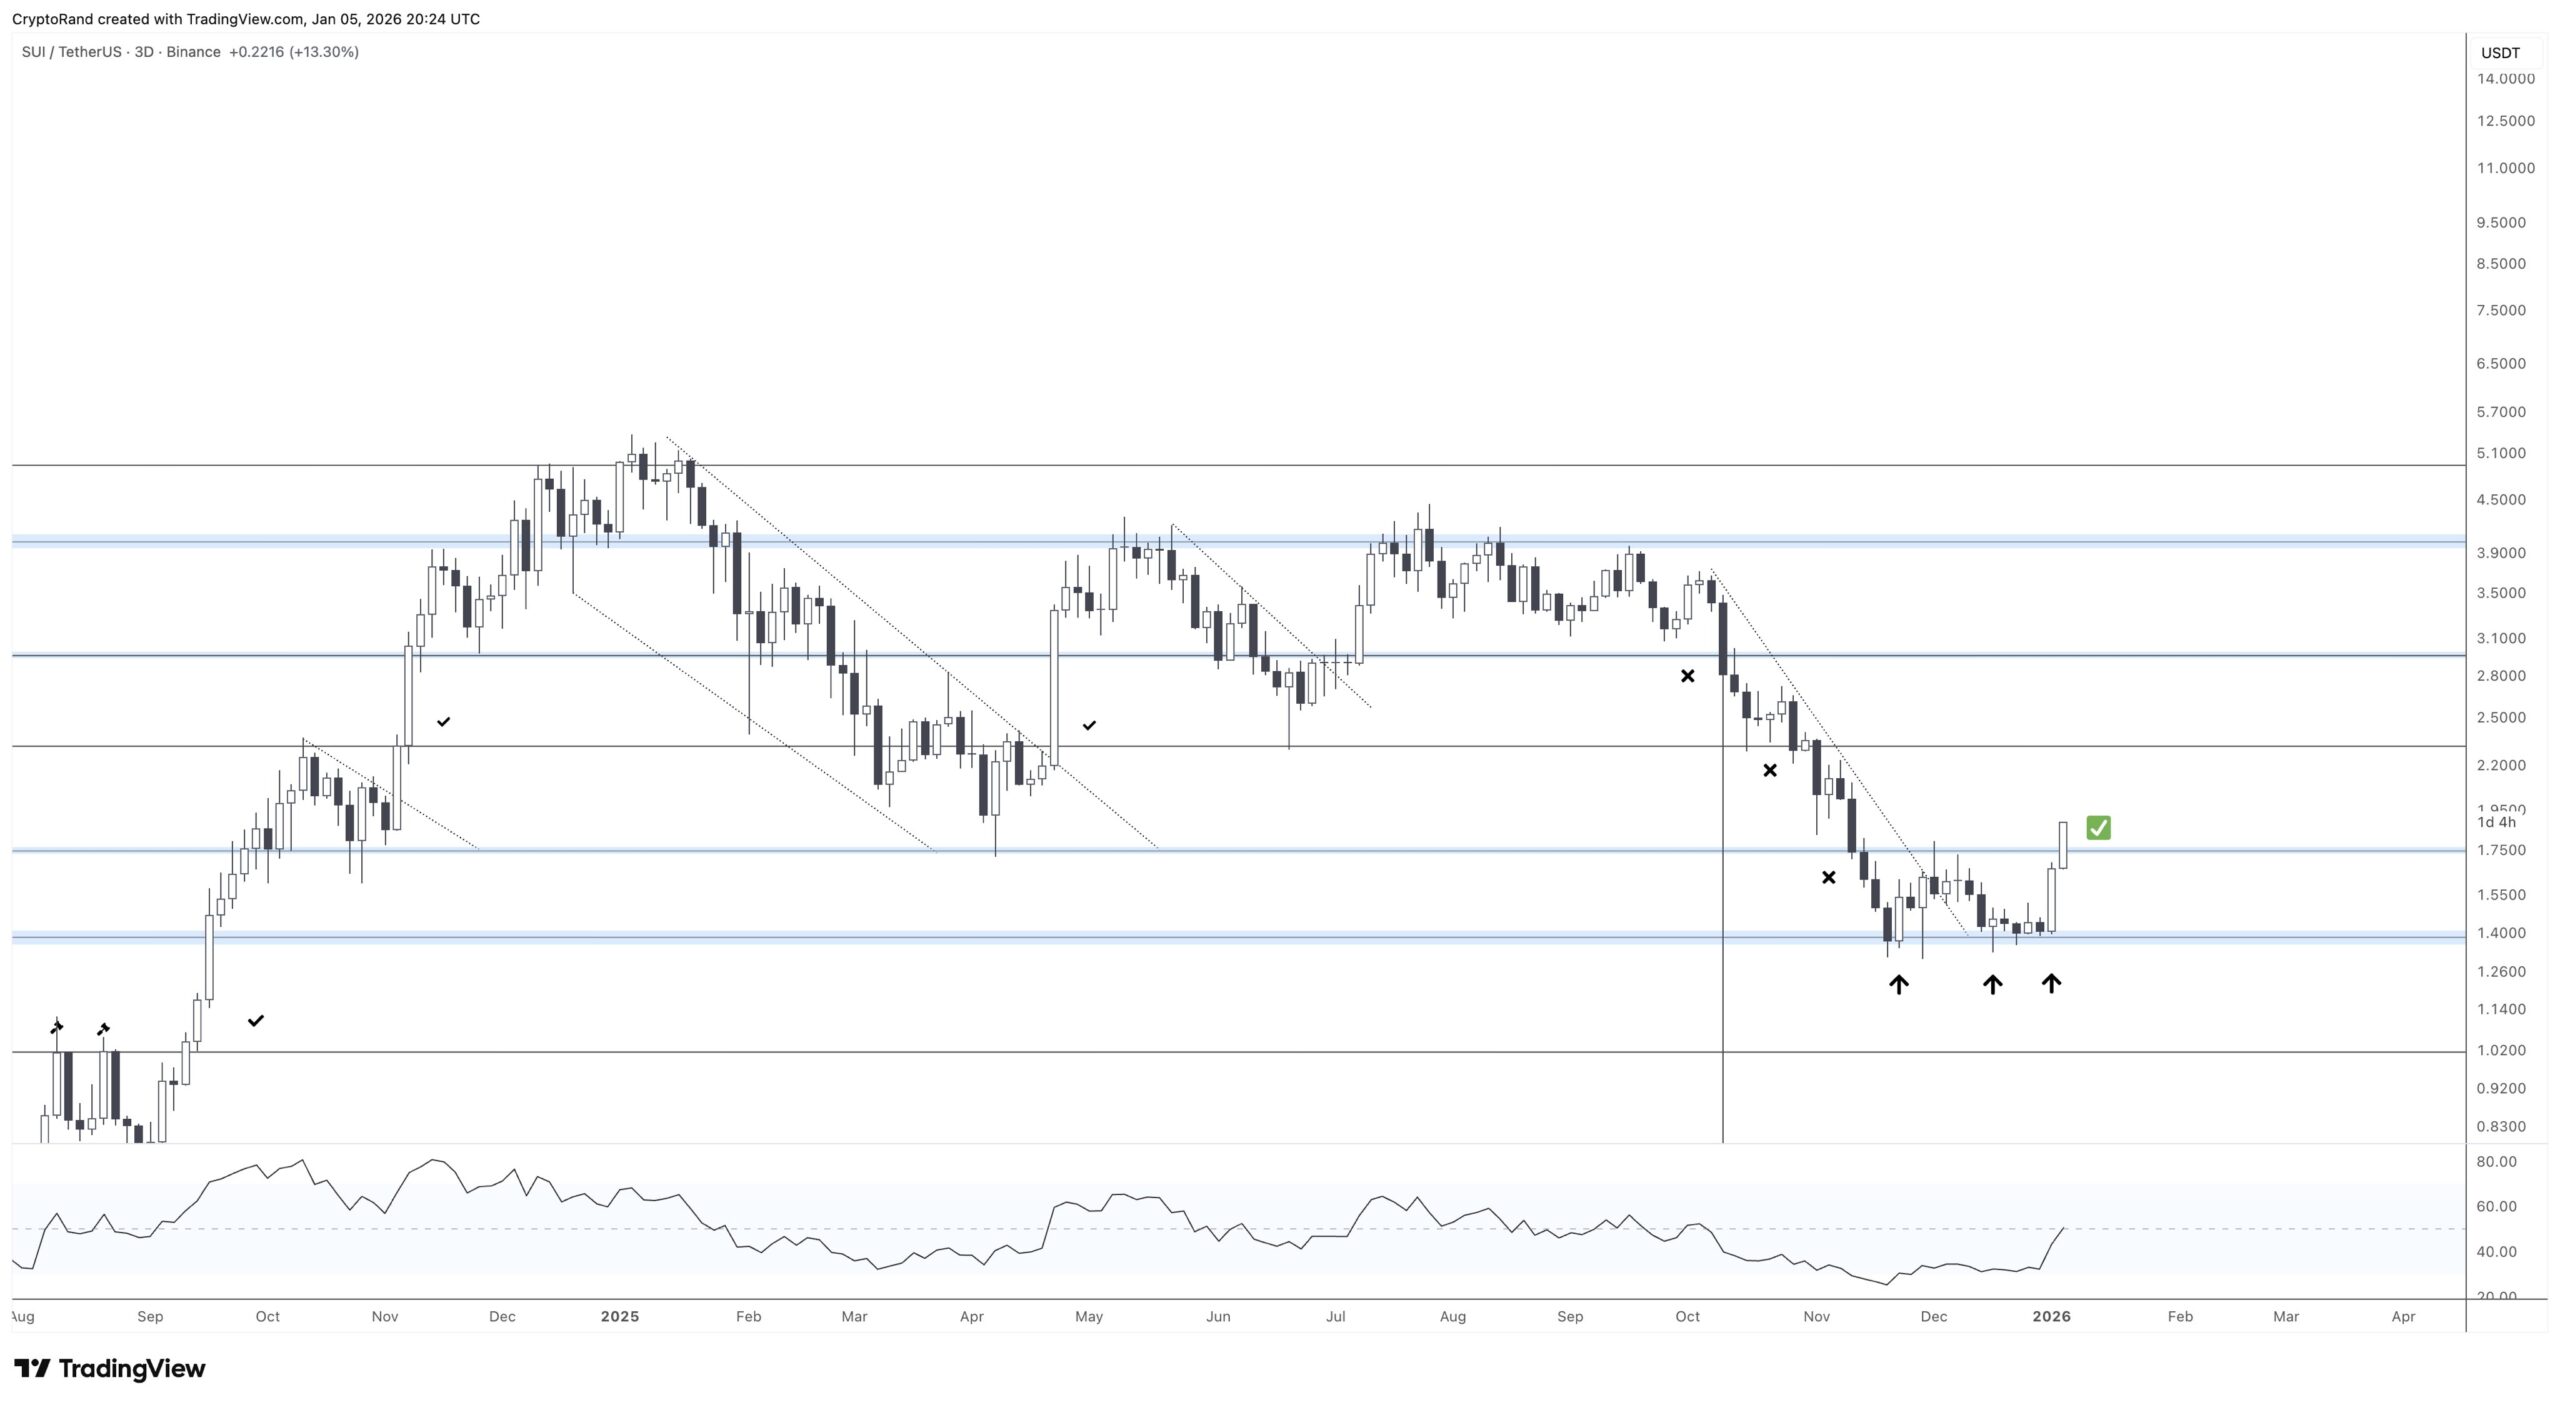
Before the rebound, SUI printed three consecutive lows in the same demand area, signaling seller exhaustion rather than aggressive distribution. Each dip below $1.50 failed to attract follow through selling.
As a result, buyers absorbed supply and gradually forced price higher. The structure shifted once SUI reclaimed the $1.75 level, which previously acted as resistance during the consolidation range. This reclaim turned $1.75 back into support and changed short term control.
At the same time, the broader downtrend lost momentum. The steep descending path that guided price lower from September broke as SUI pushed out of the lower range.
Moreover, RSI on the higher timeframe turned up from deeply compressed levels, confirming improving momentum rather than a weak technical bounce.
This combination points to a base building phase transitioning into a recovery leg.
However, confirmation still depends on continuation. Price now approaches the next resistance band between $2.10 and $2.20, which aligns with prior range structure.
A sustained hold above this zone would validate the triple bottom as a completed reversal pattern.
Until then, the move stands as a constructive upside recovery driven by demand reclaiming key levels, rather than a full trend reset.
Disclosure:This article does not contain investment advice or recommendations. Every investment and trading move involves risk, and readers should conduct their own research when making a decision.
Kriptoworld.com accepts no liability for any errors in the articles or for any financial loss resulting from incorrect information.

Tatevik Avetisyan is an editor at Kriptoworld who covers emerging crypto trends, blockchain innovation, and altcoin developments. She is passionate about breaking down complex stories for a global audience and making digital finance more accessible.
📅 Published: January 6, 2026 • 🕓 Last updated: January 6, 2026
