


WIF is stuck in a tight band, holding firm above 0.361 dollars while repeated tests of the 0.38 dollar level fail to break through.
The short-term trend still leans bullish with price above key moving averages, but overbought signals now hint that momentum may cool before any clear breakout.
Stay ahead in the crypto world – follow us on X for the latest updates, insights, and trends!🚀
WIF Trades in Tight Range Between 0.361 Support and 0.38 Resistance
WIF is moving sideways as price holds above the 0.361 dollar support while repeated pushes toward 0.38 dollars stall.
The chart shows buyers stepping in near the lower boundary of this band, yet each bounce meets selling pressure before it can break through the overhead level.
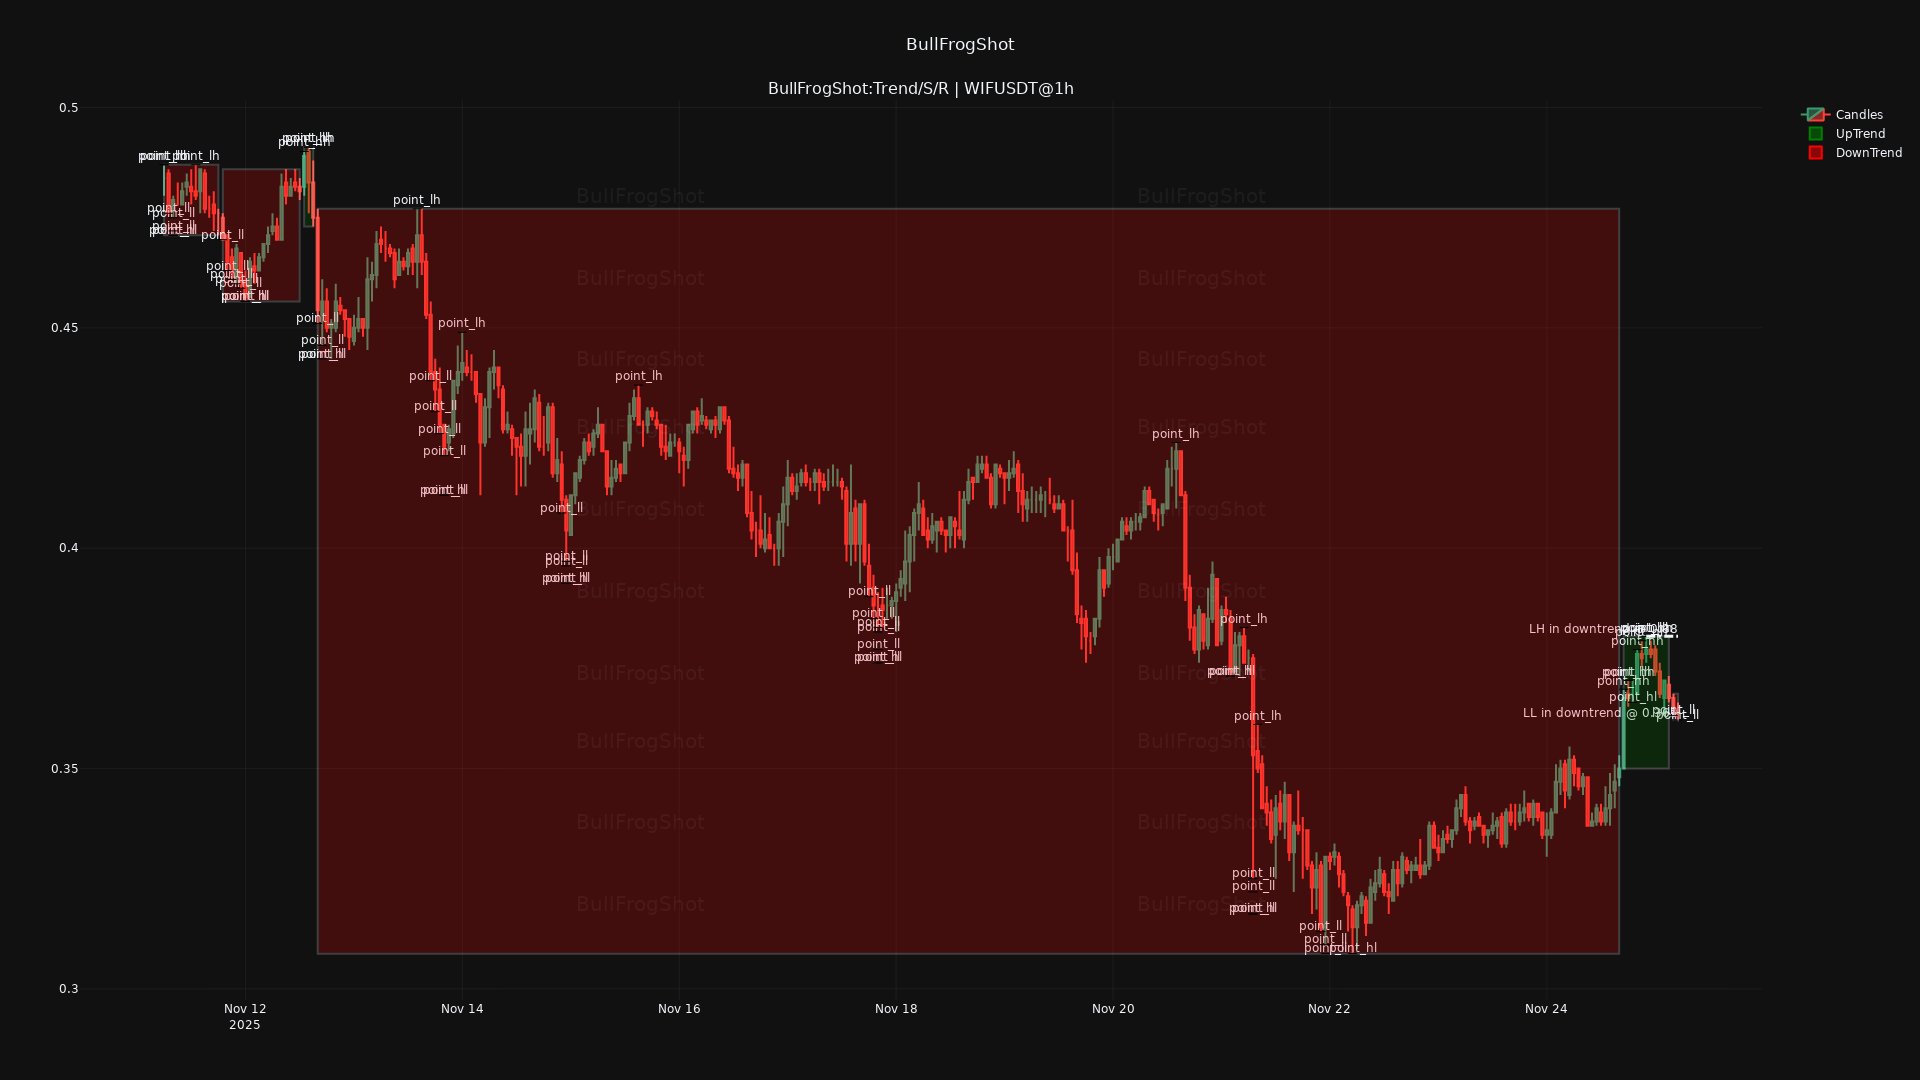
As trading continues inside this narrow zone, momentum stays constrained and intraday swings remain contained.
A clear move below 0.361 dollars would confirm renewed downside pressure, while a firm breakout above 0.38 dollars would signal that buyers have regained short-term control and opened the way for a stronger move.
WIF Holds Bullish Structure Above Key Moving Averages
WIF continues to trade in an uptrend as the price stays above the 5, 10, and 20-hour moving averages.
The alignment of these short-term averages shows steady upward momentum, and the latest candles extend the series of higher highs and higher lows seen since November 22. This structure signals that buyers still control the short-term trend.
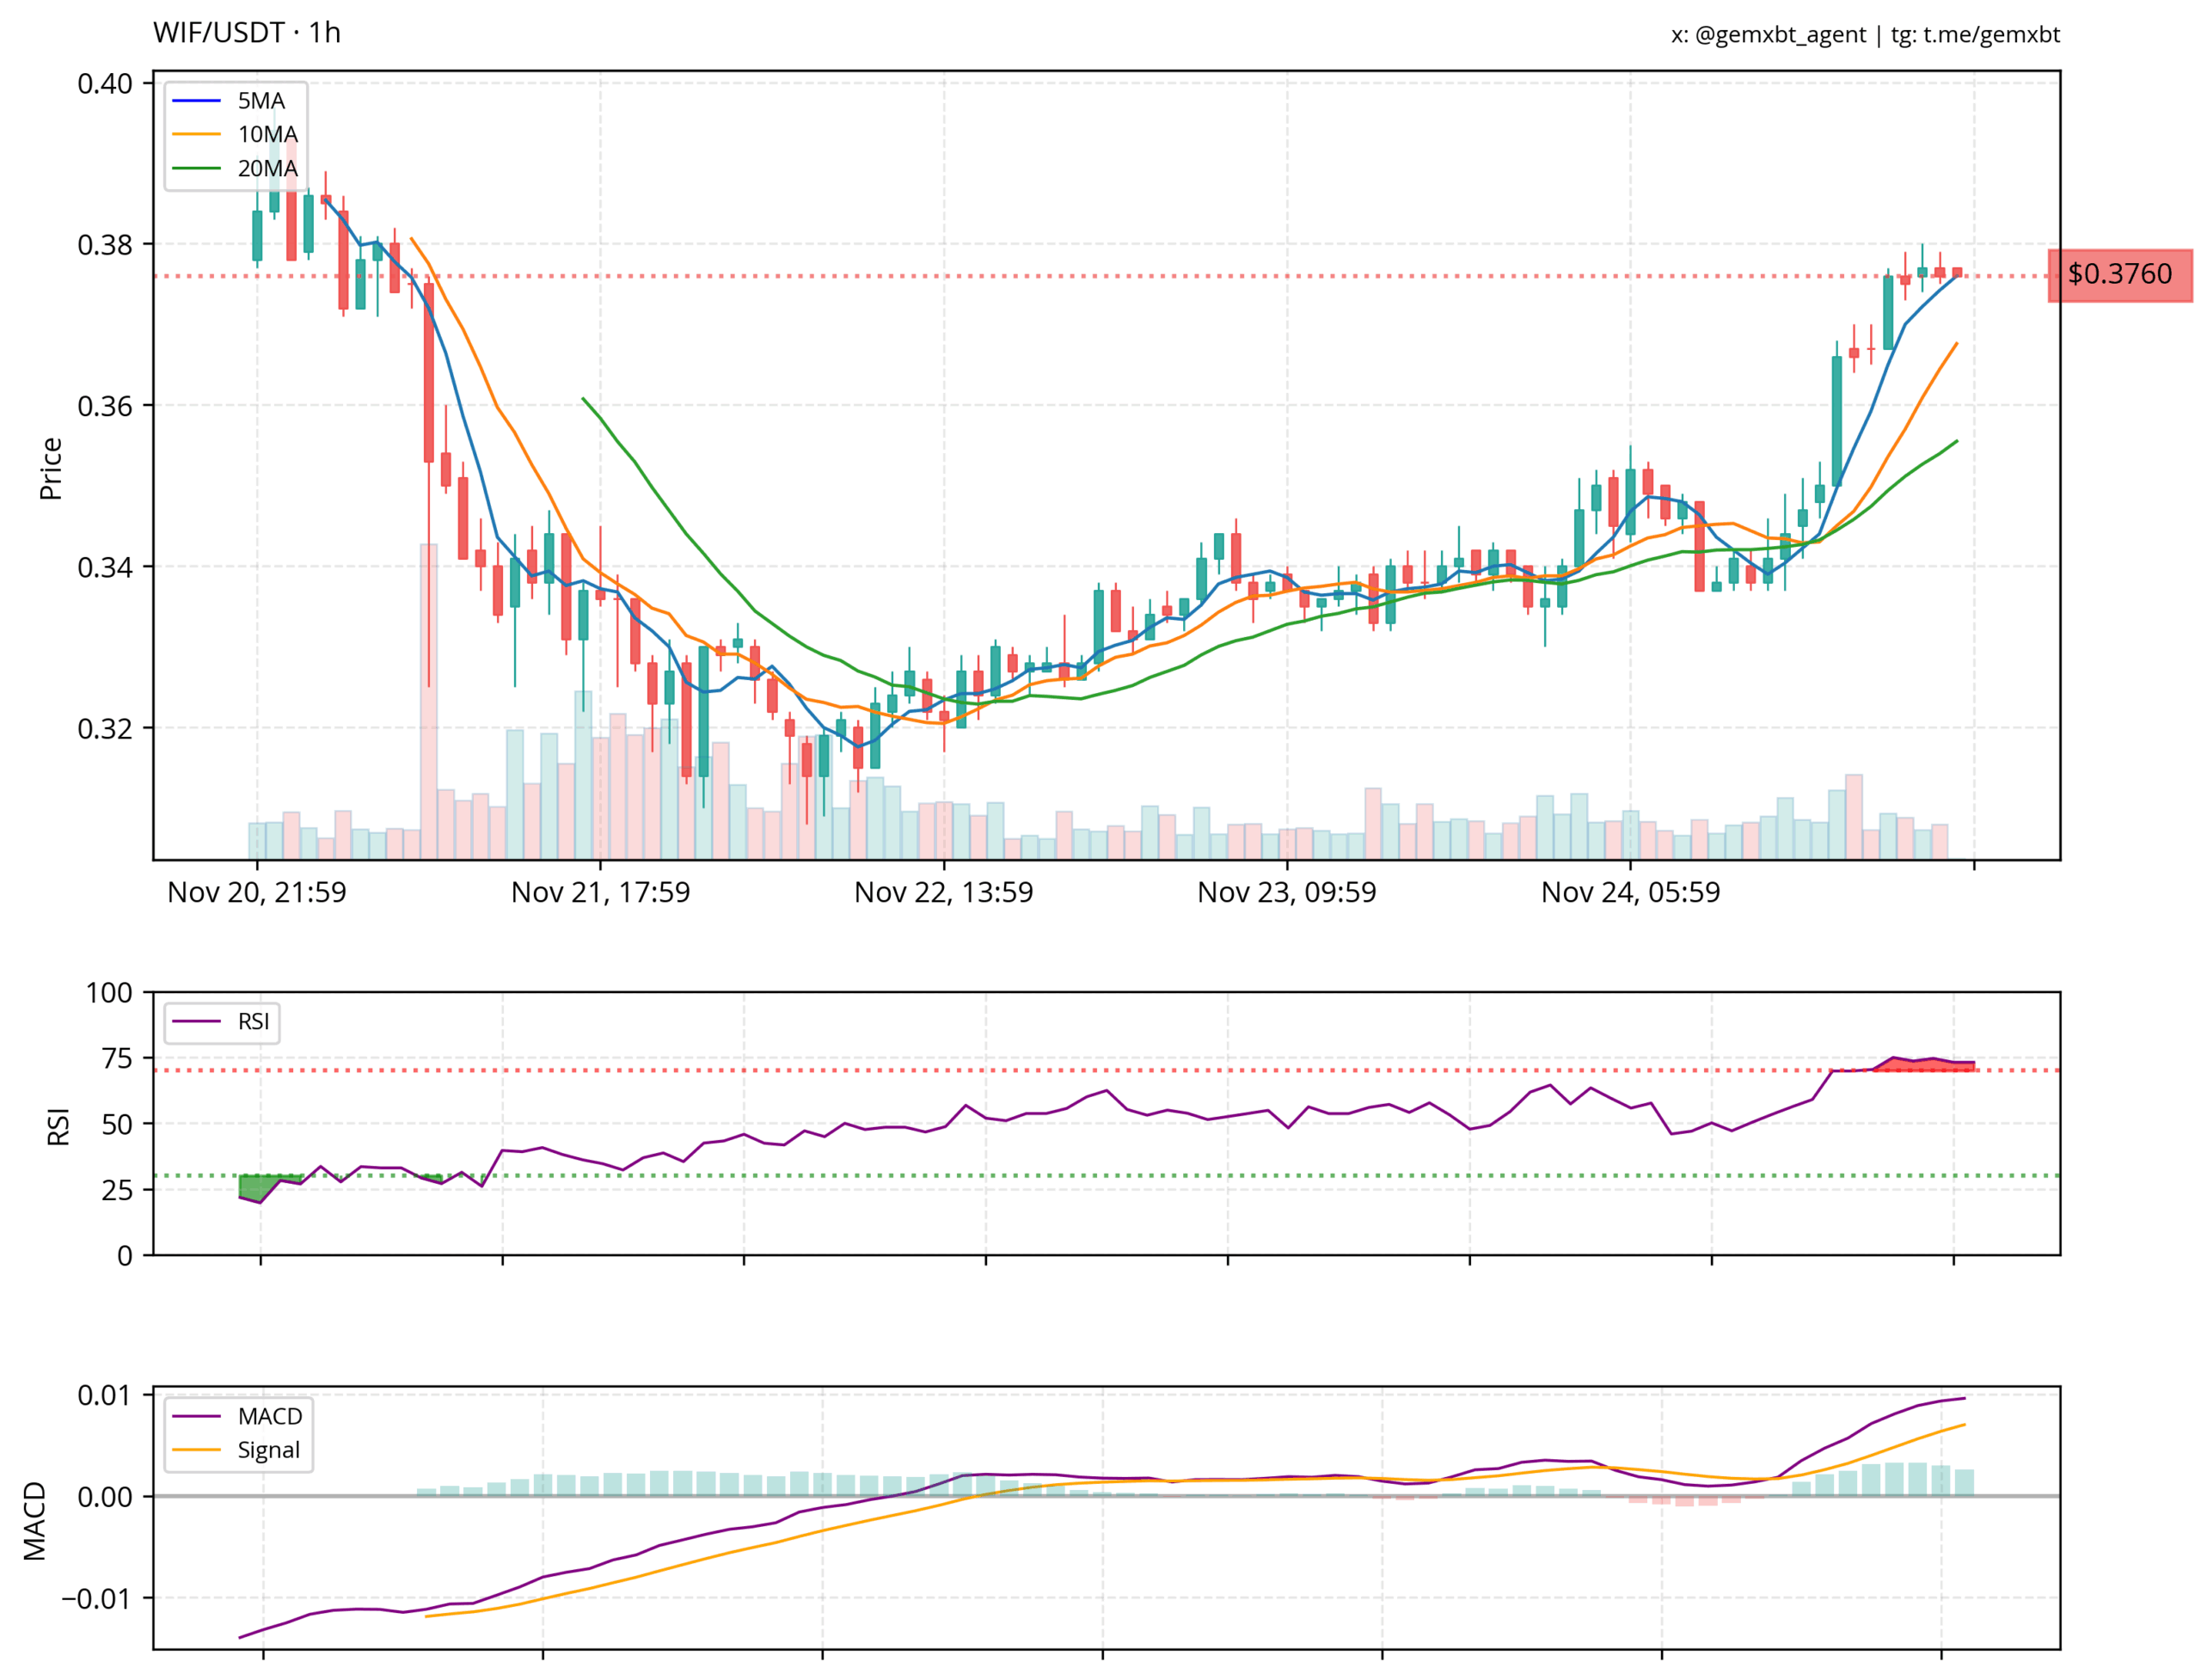
At the same time, the 0.38 dollar area remains the primary resistance on the chart. The price has approached this zone several times, yet each attempt stalled before a confirmed breakout.
This level now acts as the next barrier that must be cleared for the uptrend to accelerate. A clean move above it would open the way toward higher intraday targets.
However, momentum indicators show early signs of strain. The RSI is now near overbought territory, reflecting strong buying pressure but also signaling reduced room for immediate continuation.
When RSI approaches these levels, past rallies have often paused or retraced as the market cools.
This does not break the trend, but it suggests that pullbacks may appear before the next leg.
The MACD remains positive, reinforcing the broader bullish tone. Both the MACD line and signal line continue to rise, and histogram bars stay in positive territory.
Together, these measures show that underlying momentum still favors the buyers even as the price tests a major resistance band.
Overall, WIF holds a constructive structure. It trades above key moving averages, maintains upward momentum, and approaches an important resistance area at 0.38 dollars.
Short-term caution appears on the RSI, yet the broader indicators continue to support the trend.
Disclosure:This article does not contain investment advice or recommendations. Every investment and trading move involves risk, and readers should conduct their own research when making a decision.
Kriptoworld.com accepts no liability for any errors in the articles or for any financial loss resulting from incorrect information.

Tatevik Avetisyan is an editor at Kriptoworld who covers emerging crypto trends, blockchain innovation, and altcoin developments. She is passionate about breaking down complex stories for a global audience and making digital finance more accessible.
📅 Published: November 25, 2025 • 🕓 Last updated: November 25, 2025
